Roadmap
Previous years
Next years
2008
Development start

2009
V.1
WinForms publishing

2013
V.5
WPF publishing

2017
V.8.0
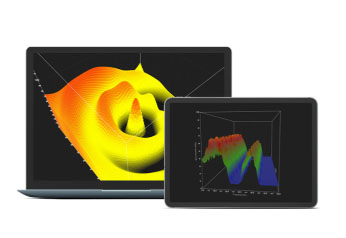
Volumetric Rendering


2018
Free Non-Commercial LightningChart License for students

2019
Q4
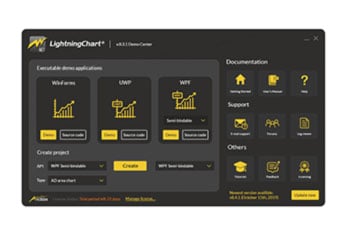
V.8.5
New DevCenter application and license management

2020
Q1
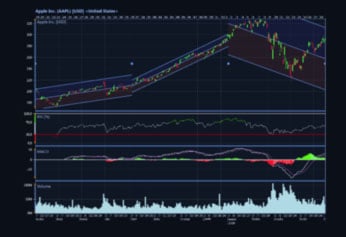
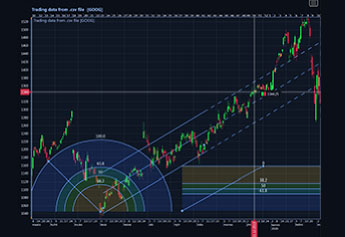
Trader
Easy trading charts with technical indicators built-in

Q2
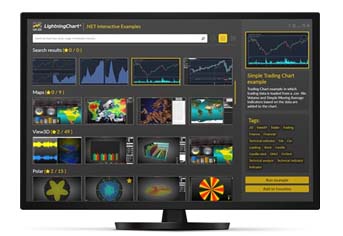
v 9.1.1
Interactive Examples App released

Q2
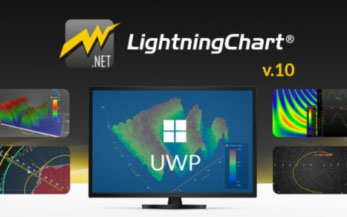
v.10
UWP charts, trader for WinForms

Q4
New Technical Indicators in Trader
2021
Q2
v.10.1.1
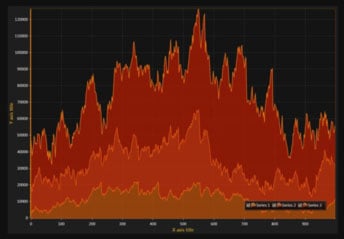
16 billion data points in real-time!

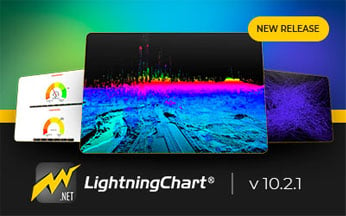
Q4
v.10.2
LightningChart .NET v.10.2.1 focuses heavily on compatibility improvements

2022
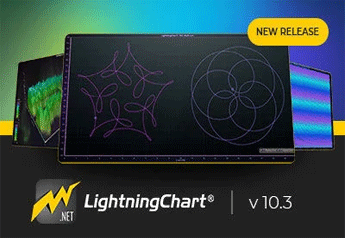
Q2
v.10.3.1
DigitalLineSeries, 1 TRILLION data points, new themes.
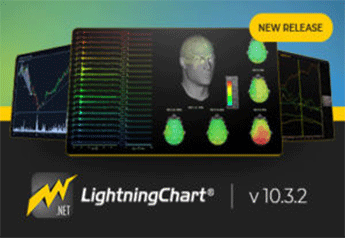
Q3
v.10.3.2
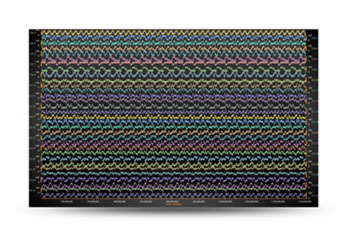
New technical indicators and drawing tools, EEG visualization and more...
Previous years
Next years
2017
Development start
2020
Q2
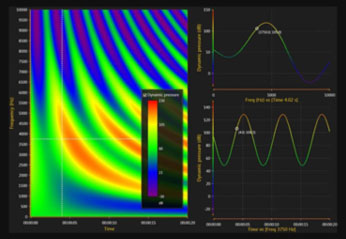
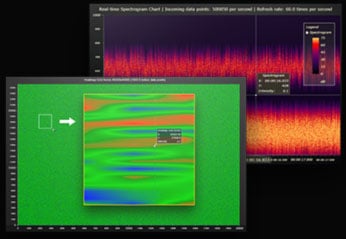
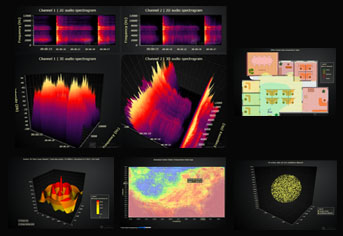
v 1.3 Heatmaps and Spectrograms
Heatmaps, constant lines, bands, etc.

Q2
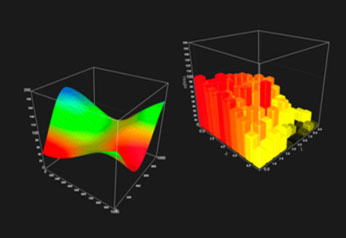
v 2.0 3D Charts
3D charts for JavaScript

Q4
v 2.1 Advanced 3D charts
Custom themes: 3D box series, 3D surface series
2021
Q2
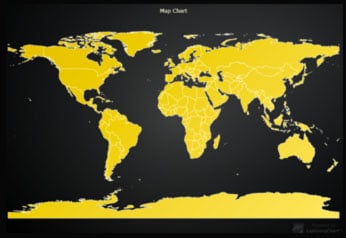
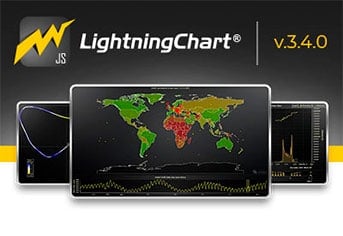
v 3.1 Polygons + Maps
Vector geographic maps, with value based coloring
Q2
v 3.2
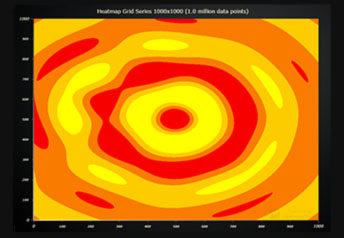
Huge breakthrough in heatmaps performance
Q4
v 3.3
Five new charts added + breakthrough performance in Surface grid charts
2022
Q1
v 3.4
Palleted lines + new Covid-19 Map ChartsSupport for data gaps & line charts improvements
2023
Q1
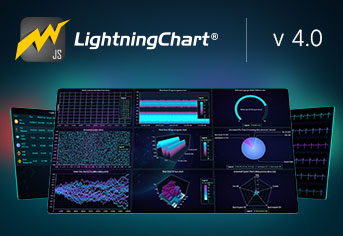
v 4.0
Beautiful charts, introducing the DataGrid component, new color Themes, and more.
Q2
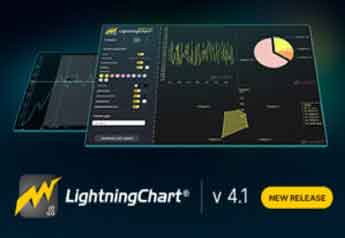
v 4.1
Dashed lines, custom ticks in 3D charts, flat themes & no-code editor, no-code themes editor, visual imprvements.
Q3
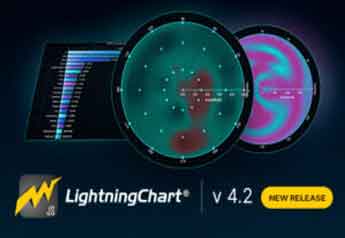
v 4.2
Polar heatmaps, bar charts, coordinate translations, developer documentation
Q4
v 5.0
WebGL Context Sharing, point-shape types, auto-cursors, performance improvements, licensing changes.
If you have any questions, feel free to contact us!
©LightningChart Ltd 2024. All rights reserved.