Introduction
LightningChart Python is a data visualization library for the Python programming language. With LightningChart Python, you can visualize real-time or static data as interactive charts with top performance.
LightningChart Python is currently available as a beta version for a limited time. During the beta period, our team is actively collecting and analyzing user feedback to enhance the user experience. Your input plays a crucial role in helping us identify areas for improvement.
You can send your feedback to [email protected]
Please be informed that during the beta period, there may be frequent updates and changes implemented to address reported issues, optimize performance, and introduce new features. This documentation will be updated accordingly.
Getting Started
Requirements
LightningChart Python requires Python version 3.10 or higher.
Installation
LightningChart Python can be installed from the Python Package Index (PyPI) using pip:
pip install lightningchart
Acquiring a license
LightningChart Python Beta requires a license key to run. You can claim your free beta license key here (click "Get Started").
Using the library
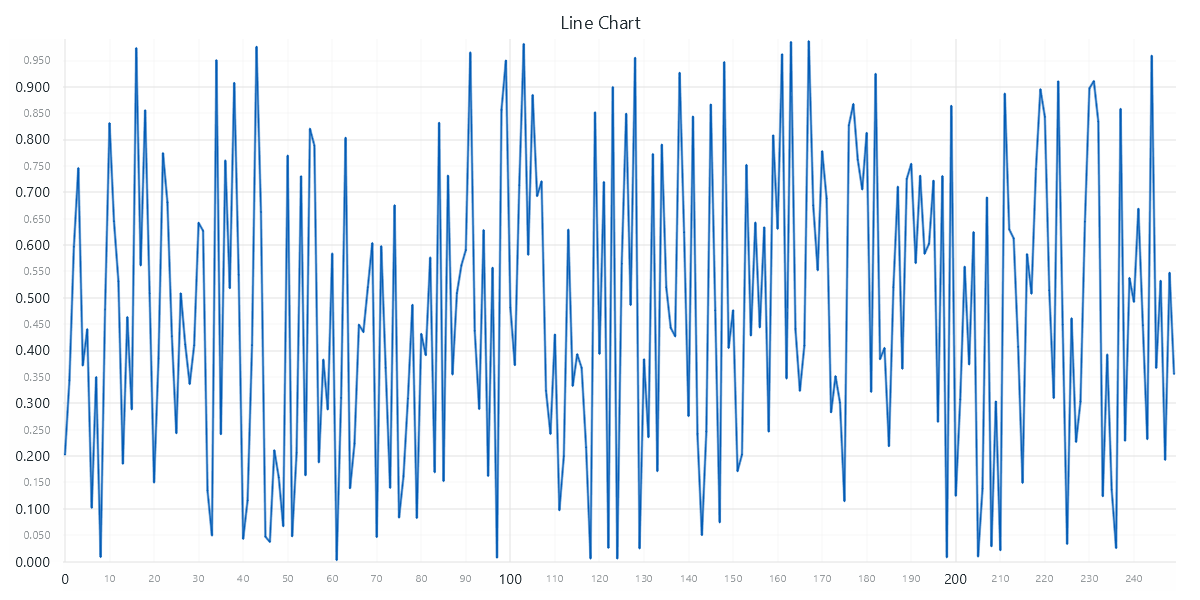
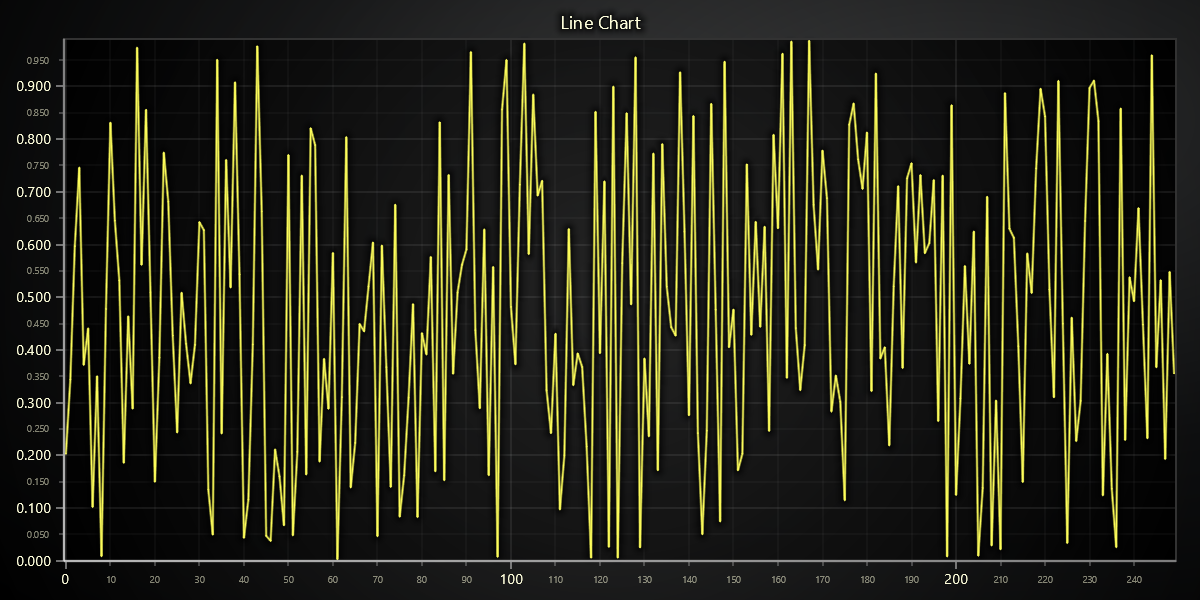
That's it! You can start creating charts with LightningChart Python, like so:
import lightningchart as lc
import random

lc.set_license('my-license-key')

x = list(range(0, 250))
y = [random.random() for _ in range(250)]

chart = lc.LineChart(x, y)
chart.open()