The new version of LightningChart JS v3.3.0 is now released.
Release date: December 1st, 2021
WebGL 2 Support
One of the key factors that enhance the performance of LightningChart JS is the WebGL graphics framework. We are happy to announce that LightningChart JS v.3.3.0 will be fully compatible with WebGL 2.
How is this going to impact end-users? In practice, your projects will continue to perform at the highest rendering performance and even users with older devices will still be able to fully use unchanged WebGL 1 support with all future releases.
Image Fill Styles
How about adding a custom background image or video to your LightningChart visualizations? The LightningChart JS v.3.3.0 includes the Image Fit Styles feature that will allow users to place external images and videos inside the charts. This is particularly helpful when trying to customize your project with backgrounds and image markers.
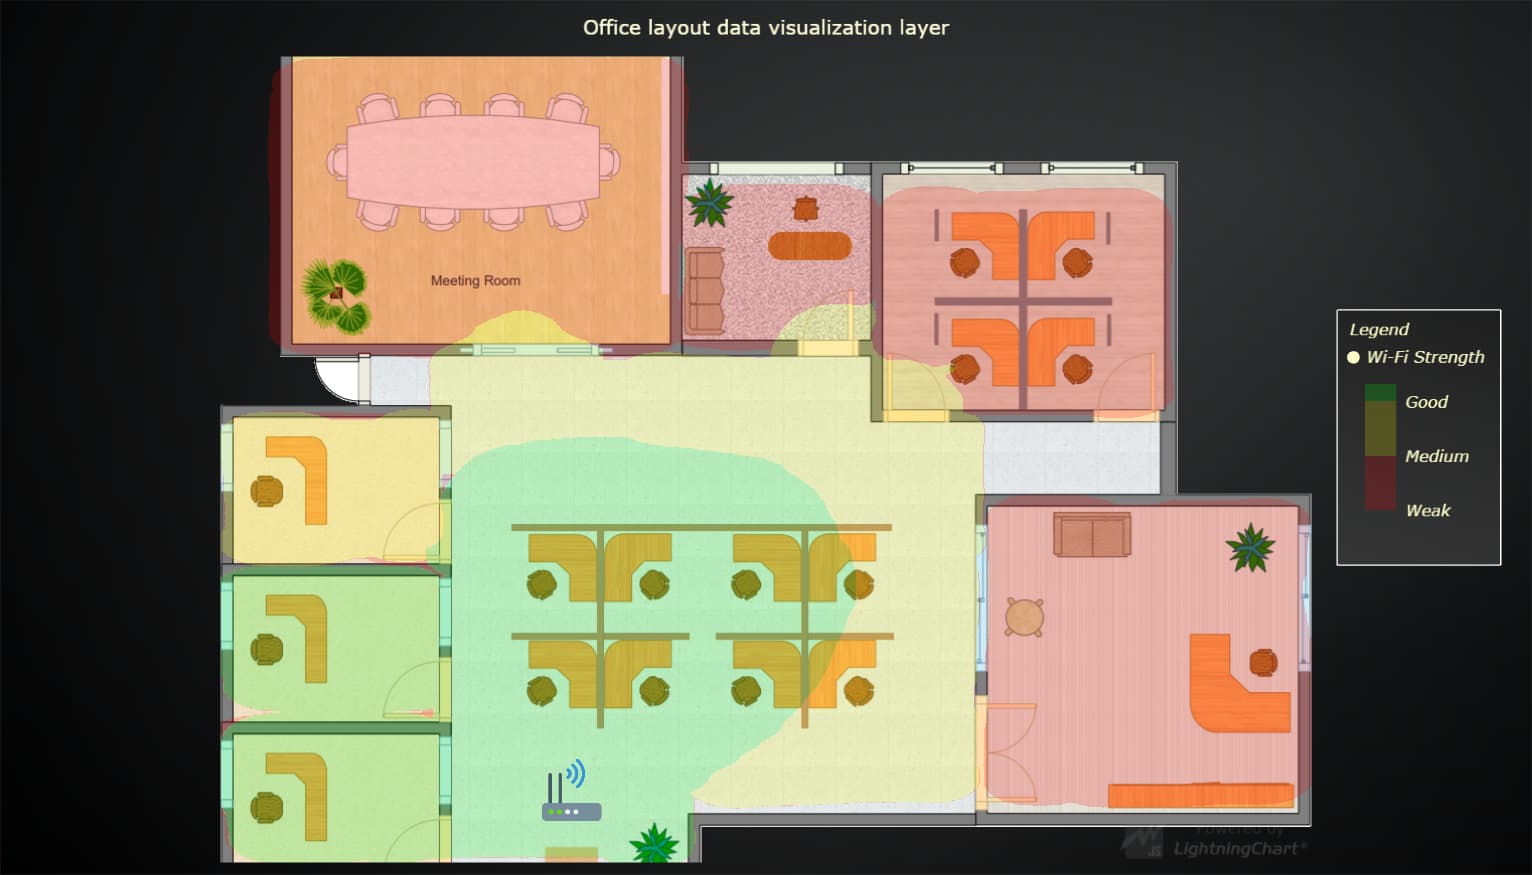
Office Wi-Fi Strength Chart
New Geospatial Data Map Chart
LightningChart JS v3.3.0 features a new geospatial map chart that is based on a background map picture with a heatmap laid over it.
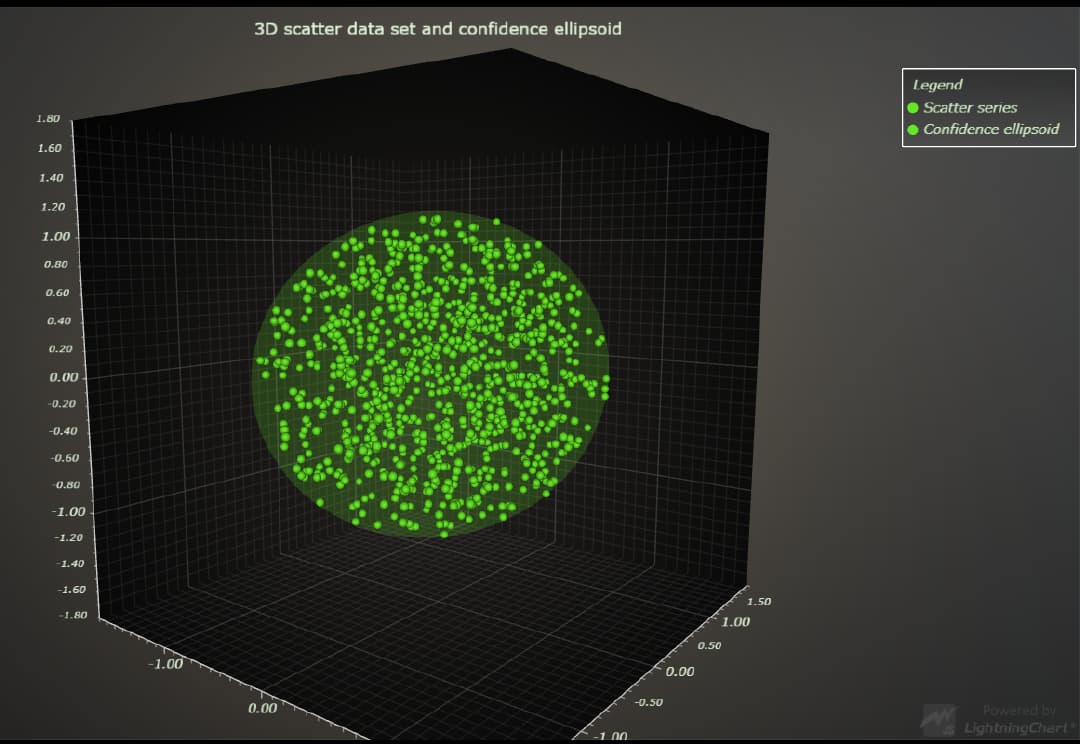
3D Ellipsoids Feature
We’re introducing the 3D ellipsoid chart that is a 3D version of our current confidence ellipses visualization. This chart is widely used in statistics to visualize, e.g., outliers in the dataset.
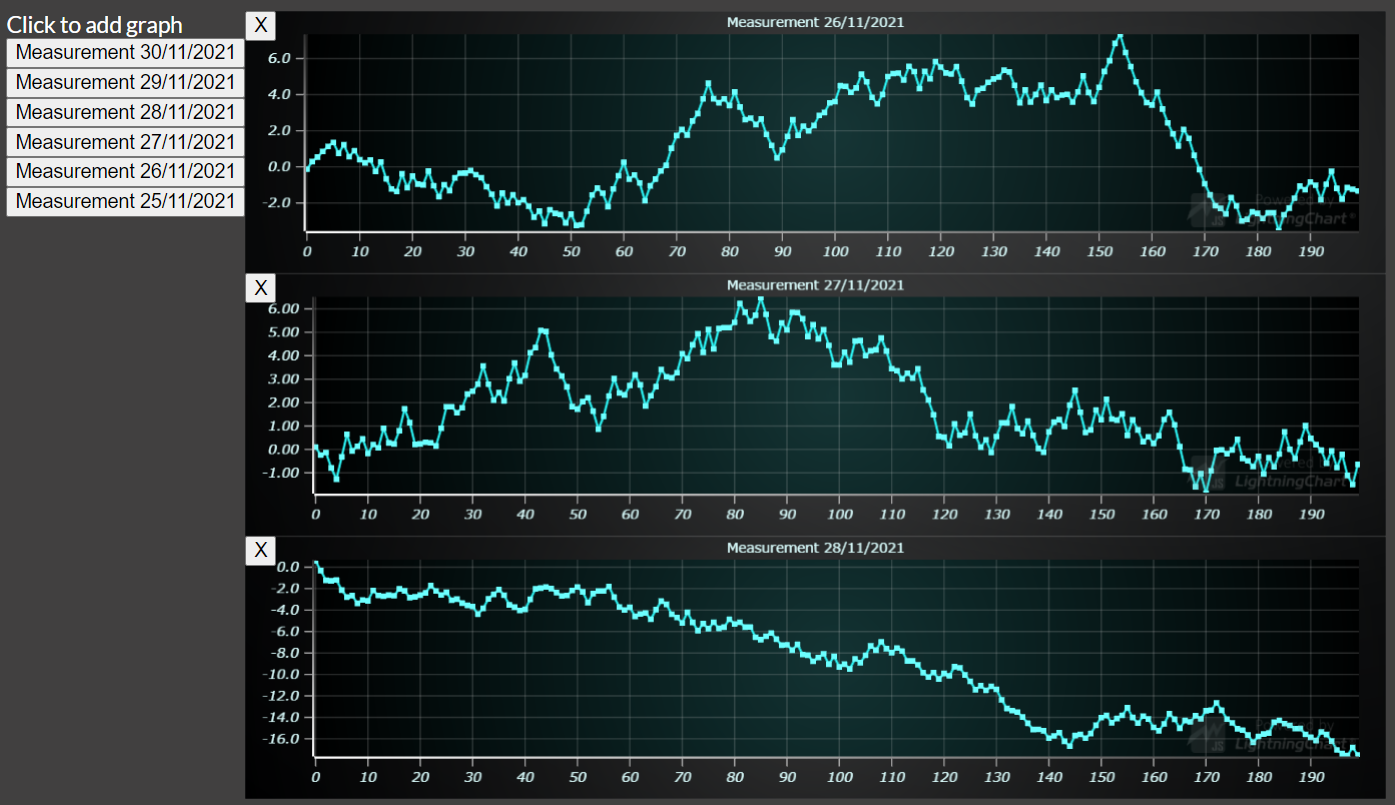
Dynamic Dashboard
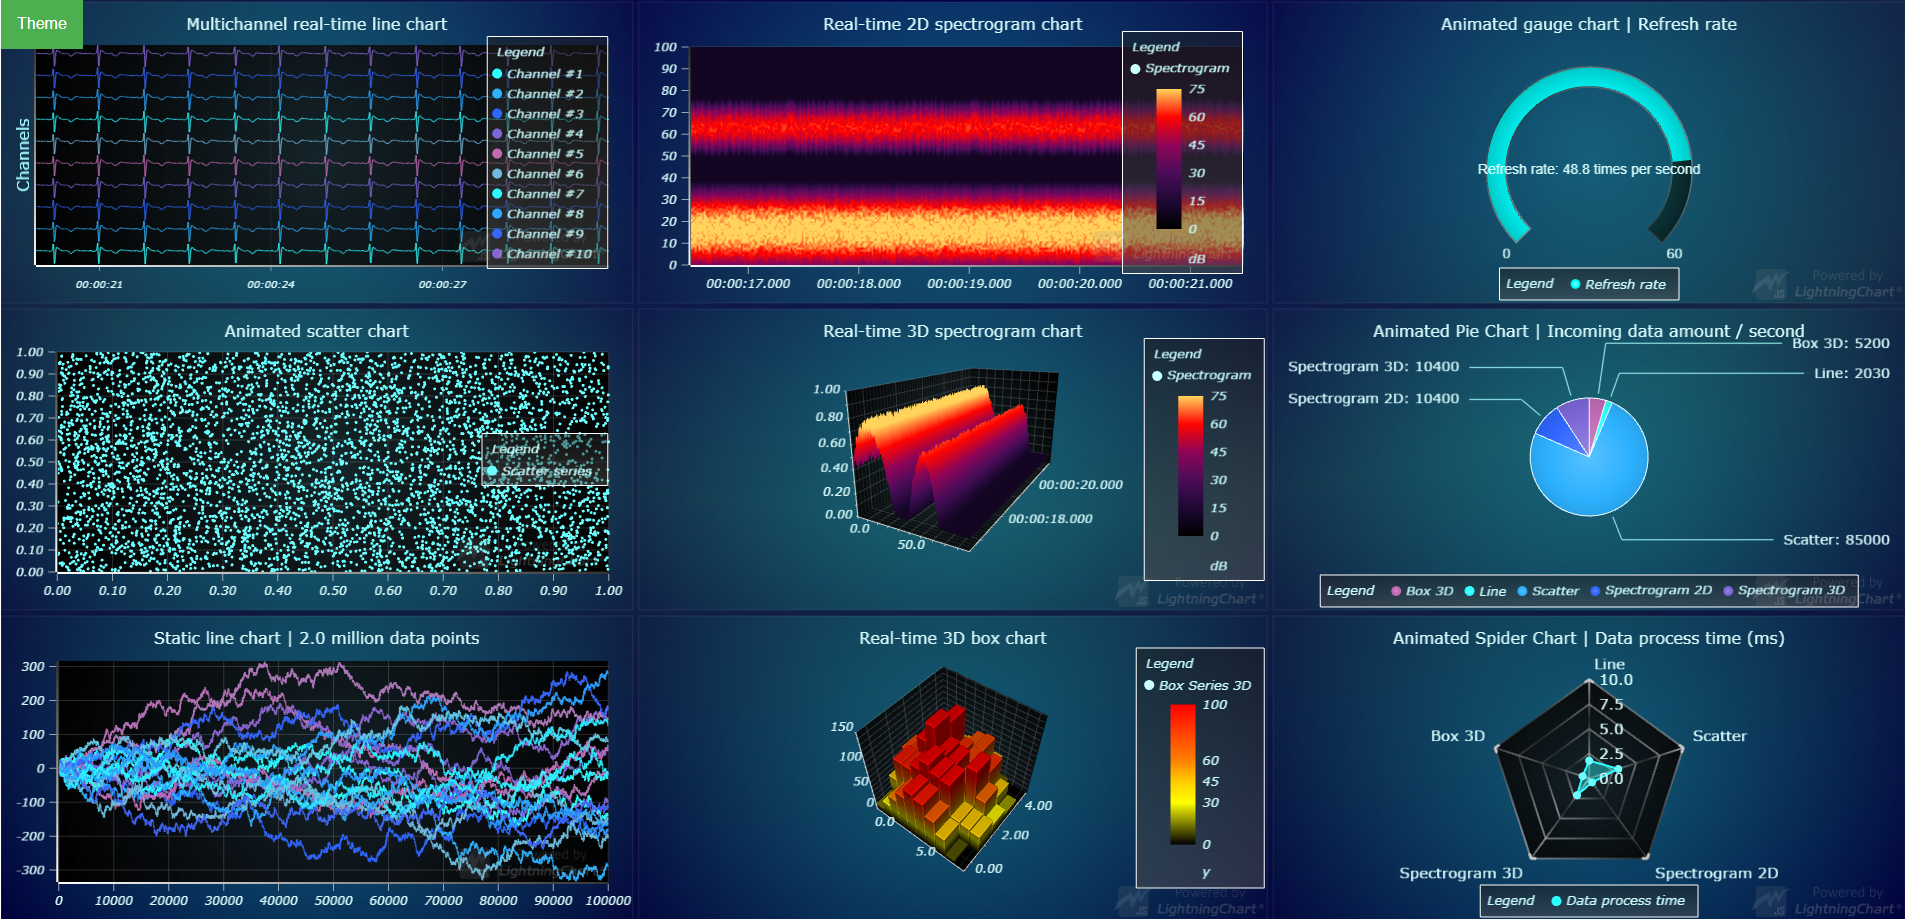
This new LightningChart JS v.3.3.0 features a Dynamic Dashboard example that allows users to dynamically add/remove charts from a view to perform interactive analyses on different data sources
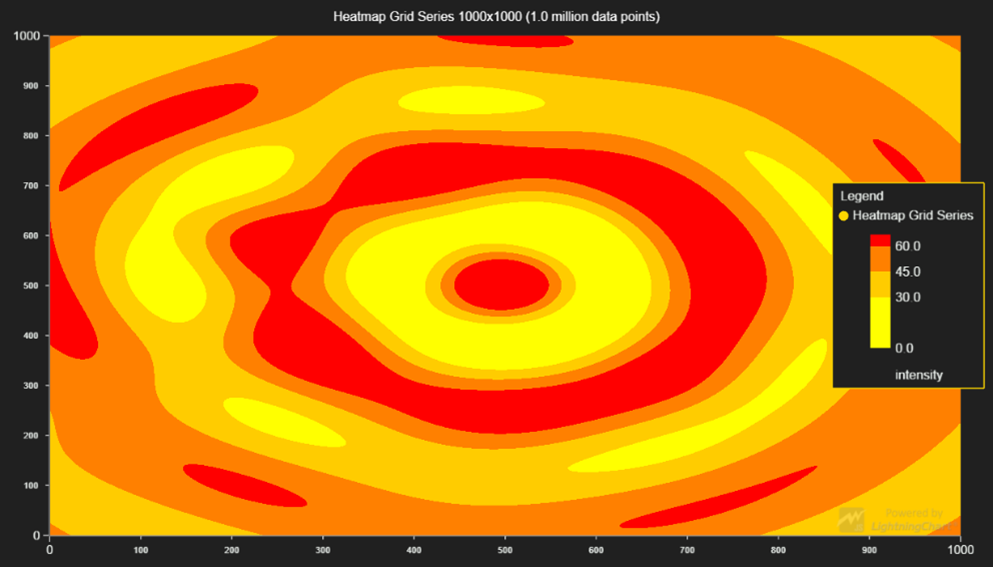
Performance Improvements & Further Optimizations in 2D Heatmaps
Performance improvements for heatmaps were a breakthrough in the previous LightningChart JS version release, but now we continued to enhance 2D heatmaps:
- For static heatmaps, the rendering capacity goes from 1.2 billion data points to 5.6 billion!
- The loading speed has increased by 250%.
- The empty heatmap loading speed increased by 10x.
- The overall performance for refreshing and appending heatmaps has significantly improved as well.
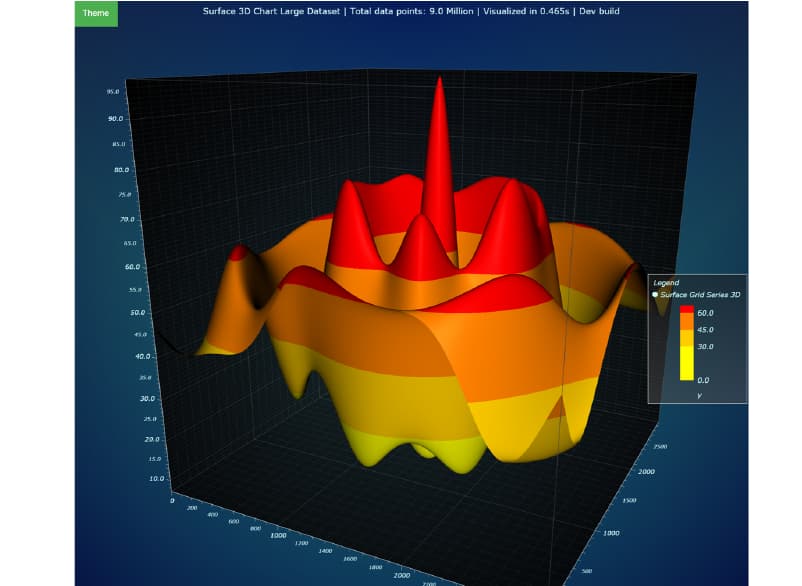
Optimized Surface 3D Grid Series
This is a major improvement for LightningChart JS v3.3.0 and the surface grid charts. The benchmark performance comparison included LightningChart JS v3.3.0 against three other charting libraries. One of those three libraries was hardware-accelerated whereas the last two were without hardware acceleration.
Some remarkable results:
When performing a test iteration using a powerful desktop device, Static Surface charts can process 130 million data points in 1 second.
For Refreshing Surface charts, LightningChart JS can handle 1 million data points per refresh at 60 FPS with only 16% CPU usage.
For Appending Surface charts with a dimension of 2 million data points have a refresh rate of 55.0 FPS at a minimum CPU usage of 2.5%.
Other Improvements
- The Line Series anti-aliasing supports a clearer and sharper look of the lines, especially on high-resolution displays.
- A new animation has been added to the Chart3D mouse wheel zoom interaction.
- As requested by some users, new methods to better customize SpiderChart and Time tick labels formatting have been added.
- Additional enhancements to the ZoomBandChart includes:
- Automatically matching the tick strategy of the attached axis.
- Automatically aligns with the attached axes.
- It now supports attaching to multiple axes.
- It now supports static heatmap series.
- Padding improvements to the default look of the charts.
- The right padding of the ChartXY has been slightly increased to avoid ticks out of the view.
- The left padding of the UICheckBox has also increased slightly for a better visual look.
- Now, Axis3D animations are enabled without affecting the performance.
- The resizing charts usability in user applications has been solved. Users do no longer need to handle resizing logic by themselves.
- Amends have been made to the visual look of the axis ticks.
- The Line Series performance in refreshing applications, e.g., decaying line chart, has been improved.
- The performance of 3D charts when rotating the camera with the automatic fitting enabled has been significantly improved.
Learn more about the new version LightningChart® JS v.3.3.0
