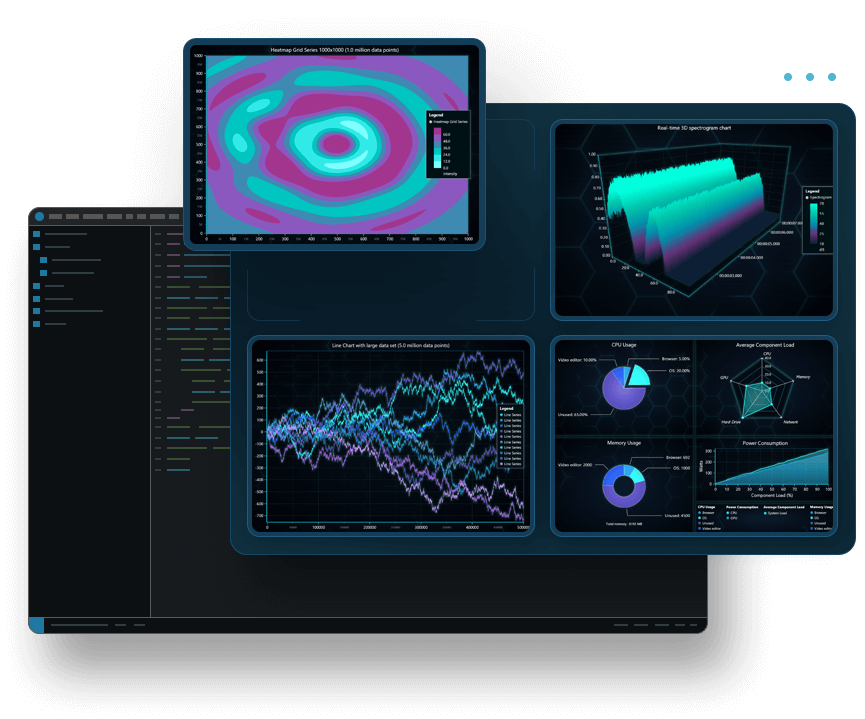
Powering your next charting application

Build your next application with LightningChart JS Web-GL and GPU-accelerated charting components
Develop faster with pre-built components
LightningChart JS charting controls are ready for a fast and seamless integration within apps for any industry
Sweeping Line Chart
The Sweeping Line Chart is a visually dynamic chart type that represents the movement or progression of data points over time or across a particular variable. It uses sweeping lines to connect data points, creating a fluid and continuous visual representation of the data.
Characteristics:
- Time-based visualization showing data changes over a period.
- Continuous sweeping lines connect data points for smooth transitions.
- Clear depiction of trends, fluctuations, or patterns in data.
- Enables easy comparison of multiple datasets on a single chart.
- Useful for analyzing and forecasting data trends over time.
Decaying Line Chart
A Decaying Line Chart is a type of line chart that visually emphasizes the trends and patterns in the data by connecting the data points with a smooth line that “decays” across the graph. This effect is achieved by preparing an individual LineSeries for each displayed sample and updating the stroke style on every update. Older samples are constantly updated with increasing transparency colors to give a “decaying” effect.
Characteristics:
- It is useful for showing how a variable changes over time with a decaying trend.
- It can reveal the rate of decay of the trend over time.
- It can indicate the presence or absence of a relationship between two variables.
- It can show the overall trend of the data and how it changes over time.
- It is beneficial for visualizing a large set of data points and identifying trends.
Temperature Anomaly Chart
A temperature anomaly line chart is a type of chart that displays changes in temperature over time. The chart shows the deviation from a baseline temperature, usually an average temperature over a certain period. The horizontal axis represents time, while the vertical axis represents the temperature anomaly.
Characteristics:
- It is useful for visualizing changes in temperature over time and identifying trends.
- It can show the deviation from a baseline temperature, which can be useful for identifying patterns and anomalies.
- It can indicate the presence or absence of a long-term trend in temperature.
- It can be used to compare temperature data from different locations or time periods.
- It is often used in climate science to study the effects of climate change.
Heatmap Spectrogram Chart
A Spectrogram XY-Projection Heatmap Chart is a type of chart that displays the relationship between three variables using Cartesian coordinates. The x-axis represents time, the y-axis represents frequency, and the color or intensity of each point represents the amplitude of the signal at that point. This type of chart is commonly used in signal processing and audio analysis to visualize the frequency content of a signal over time.
Characteristics:
- It is useful for visualizing large sets of data in a grid format.
- It uses color-coded cells to represent values in a dataset, making it easy to identify patterns and trends.
- It uses bilinear interpolation to smooth the data visualization and create a more continuous color gradient.
- It can be used to visualize data according to geographical location, such as weather trends or demographic information.
- It is a powerful tool for representing the magnitude of a value in a color code ranging from minor to major intensity.
Heatmap Bilinear Interpolation Chart
A bilinear interpolation chart is a type of chart that displays data in a grid format using color-coded cells to represent values in a dataset. The chart uses a technique called bilinear interpolation to smooth the data visualization by automatically interpolating intensity values and creating a more continuous color gradient.
Characteristics:
- It is useful for visualizing large sets of data in a grid format.
- It uses color-coded cells to represent values in a dataset, making it easy to identify patterns and trends.
- It uses bilinear interpolation to smooth the data visualization and create a more continuous color gradient.
- It can be used to visualize data according to geographical location, such as weather trends or demographic information.
- It is a powerful tool for representing the magnitude of a value in a color code ranging from minor to major intensityю
Distance intensity chart
A distance intensity chart is a type of chart that visualizes the density or intensity of variables in a two-dimensional space. It represents the magnitude of individual values within a dataset as a color, with the variation in color indicating the intensity of the phenomenon.
Characteristics:
- It is useful for identifying patterns, trends, and correlations between variables.
- It can show the density or intensity of variables in a two-dimensional space.
- It can highlight the extent of the phenomenon to make it easier to interpret.
- It is beneficial for visualizing large datasets and identifying trends.
- It can be used to represent geographical distributions of data.
Large Scatter Chart
A large scatter chart is a type of chart that displays the relationship between two variables using Cartesian coordinates. Each point on the chart represents a single data point, and the horizontal position indicates one variable while the vertical position indicates the other variable.
Characteristics:
- It is useful for identifying patterns and relationships between two variables.
- It can show if there are any unexpected gaps in the data and if there are any outlier points.
- It can indicate the presence or absence of an association or relationship between two variables.
- It can suggest various kinds of correlations between variables with a certain confidence interval.
- It is beneficial for visualizing a large set of data points and identifying trends.
Confidence Ellipse Chart
A Confidence Ellipse Chart is a type of chart that displays a scatter plot with an ellipse drawn around the data points. The ellipse represents the confidence interval of the data points, which is a measure of the uncertainty of the data.
Characteristics:
- The chart displays a scatter plot with an ellipse drawn around the data points.
- The ellipse represents the confidence interval of the data points.
- The size and shape of the ellipse depend on the variance and covariance of the data.
- The confidence level of the ellipse is typically set to 95%.
- The chart is useful for visualizing the uncertainty of the data and identifying outliers.
2D Points Value Palette Coloring
2D Points Value Palette Coloring is a chart type that allows dynamic coloring based on any kind of data set. The chart is colored using a value palette, which is a powerful feature that enables the chart to be colored based on the data set.
Characteristics:
- The chart is colored using a value palette, which allows dynamic coloring based on any kind of data set.
- The most prominent dimension of color for a sequential palette is its lightness. Typically, lower values are associated with lighter colors, and higher values with darker colors.
- Sequential and diverging palettes can be associated with data values in two different ways: either as a discrete set of colors, each one associated with a numeric range, or as a continuous.
- The chart type is commonly used for heatmaps, which take the form of a grid of colored squares, where colors correspond with cell value.
- Careful use of colors in plots, images, maps, and other data graphics can make it easier for the viewer to understand the data being presented.
Flow Cytometry Chart
A Flow Cytometry Chart is a type of data visualization that displays the distribution of cells in a sample based on their physical and chemical properties. It is commonly used in the field of biology and medicine to analyze and quantify cell populations.
Characteristics:
- Flow Cytometry Charts can be represented in different types of plots such as histograms, density blots, and contour diagrams.
- The X-axis of a Flow Cytometry Chart represents the amount of fluorescence emitted by the cells, while the Y-axis represents the number of cells.
- Flow Cytometry Charts can be used to identify specific cell types based on their physical and chemical properties.
- Flow Cytometry Charts can be used to analyze the distribution of cells in a sample, such as the percentage of cells in a specific phase of the cell cycle.
- Flow Cytometry Charts can be customized with different color palettes to enhance their visual appeal and readability.
ECG Chart
An ECG chart, also known as an electrocardiogram, is a graph that shows the electrical activity of the heart over time. It is a non-invasive test that records the electrical signals of the heart through electrodes placed on the skin.
Characteristics:
- The ECG chart is a graph that shows the electrical activity of the heart over time.
- Each lead of the ECG recording is slightly different in shape because it records the electrical activity of the heart from a different direction.
- The height of the deflection on the ECG represents the amount of electrical activity flowing in that direction.
- The ECG chart can be used to determine the heart rate, rhythm, and cardiac axis.
- The ECG chart consists of five waves: P, Q, R, S, and T, corresponding to different phases of the heart activities.
Medical Dashboard
The Medical Dashboard is a visual representation of various medical data, including ECG/EKG (electrocardiogram), NIBP (Non-invasive blood pressure measurement), BFV (Blood flow volume), and Sp02 (Blood oxygen saturation). The dashboard is designed to provide healthcare providers with a quick and easy way to monitor a patient's vital signs and other important medical data.
Characteristics:
- Customizable chart types: The dashboard allows users to choose from a variety of chart types to display their data, including line charts, bar charts, and pie charts.
- Real-time data: The dashboard displays data in real-time, allowing healthcare providers to monitor a patient's vital signs and other important medical data as it happens.
- Multiple data sources: The dashboard can pull data from multiple sources, including electronic health records (EHRs), medical devices, and other healthcare systems.
Data Grid Crypto Dashboard
A Data Grid Crypto Dashboard is a type of chart that displays data in a tabular format with rows and columns. It is commonly used in financial and business settings to track and analyze large amounts of data, such as cryptocurrency prices and trading volumes.
Characteristics:
- Tabular format: The data is presented in a table with rows and columns, making it easy to compare and analyze large amounts of information.
- Customizable: The dashboard can be customized to display specific data points and metrics, allowing users to focus on the information that is most relevant to them.
- Interactive: Users can interact with the dashboard by sorting, filtering, and searching the data to find specific information.
- Real-time data: The dashboard can be updated in real-time, providing users with the most up-to-date information.
- Multiple data sources: The dashboard can pull data from multiple sources, allowing users to view and analyze data from different platforms and exchanges.
Monitoring Data Grid Heatmap
A Monitoring Data Grid Heatmap is a two-dimensional chart that displays data in a tabular format using variations in color to represent values. Each cell in the table represents a unique combination of categories, with the color of the cell indicating the value of the data.
Characteristics:
- It is a two-dimensional chart that displays data in a tabular format.
- It uses variations in color to represent values.
- Each cell in the table represents a unique combination of categories.
- The color of the cell indicates the value of the data.
- It is useful for comparing categories and emphasizing relationships between data values that would be harder to understand in a simple table with raw numbers.
3D Confidence Ellipsoid Chart
The 3D Confidence Ellipsoid Chart is a type of chart that displays a three-dimensional representation of a confidence ellipsoid. This chart is commonly used in statistical applications to visualize the area of confidence for a set of data.
Characteristics:
- It displays a three-dimensional representation of a confidence ellipsoid.
- It is commonly used in statistical applications.
- It visualizes the area of confidence for a set of data.
- It can be used to display multiple sets of data.
- It can be customized to display different levels of confidence.
Box and Violin chart
A Box and Violin chart is a combination of a box plot and a density plot that shows the distribution shape of the data. It is a useful chart type for visualizing the distribution of data across different categories or groups.
Characteristics:
- The chart displays the distribution of data using a combination of a box plot and a density plot.
- The box plot shows the median, quartiles, and outliers of the data.
- The density plot shows the shape of the distribution of the data.
- The width of the violin plot corresponds to the density of the data at that point.
- The chart can be used to compare the distribution of data across different categories or groups.
Mosaic Chart
A Mosaic Chart is a graphical representation of data from two or more qualitative variables. It is a special type of stacked bar chart that shows percentages of data in groups. The width of the columns is proportional to the number of observations in each level of the variable plotted on the horizontal axis, while the vertical length of the bars is proportional to the number of observations in the second variable within each level of the first variable.
Characteristics:
- Mosaic Charts are used to display associations among categorical variables.
- They are a graphical representation of a contingency table.
- The area of the tiles is proportional to the number of observations within that category.
- Mosaic Charts are simple versions of heat maps.
- They are useful to show relationships between different variables and to provide a visual comparison of groups.
Funnel Chart
A Funnel Chart is a data visualization tool that represents a linear process or data flow through connected stages. The chart resembles a funnel with a broad head at the top and a narrow neck at the bottom.
Characteristics:
- It is used to showcase sales funnels, sales management, order fulfillment, and recruitment.
- It tracks workflow and analyzes conversions.
- It does not use an axis to represent data on a graph.
- It depicts data regression as it moves from one phase to another.
- It follows a simple hierarchy where the highest number of values go at the top and moves down to the next highest till it reaches the lowest number of data values.
Pyramid Chart
A Pyramid Chart is a triangular-shaped chart that is used to represent hierarchical data or information. The chart is divided into sections, with each section representing a related topic or idea. The width of each section varies, indicating a level of hierarchy among the topics. The widest section may contain a general topic, while the narrowest section may contain a more specific topic from within that general topic.
Characteristics:
- It is a triangular-shaped chart that is used to represent hierarchical data or information.
- The chart is divided into sections, with each section representing a related topic or idea.
- The width of each section varies, indicating a level of hierarchy among the topics.
- Pyramid Charts are ideal for explaining and visualizing categories, rankings, or groupings of information.
- They are easy to create, and you can draw horizontal lines to create sections in a triangle or use a Pyramid Chart template that already has predefined sections and just name them.
Map Chart
A map chart is a type of chart that displays data on a geographical map. It allows organizations to position data or visualize spatial relationships using geographical context.
Characteristics:
- Map charts use geographical maps to represent data.
- They facilitate tagging of specific metrics against geographical locations.
- Map charts require users to have geographical regions as part of their data.
- They can show data points on a map by indicating markers at geographical coordinates.
- Map charts can vary marker shape, color, and size, and can show pie charts for each location.
Animated Geographical Temperature Chart
The animated geographical temperature chart is a type of heat map chart that displays temperature data on a geographical map. The chart uses color variations to represent the temperature range across different locations.
Characteristics:
- The chart displays temperature data on a geographical map.
- The chart uses color variations to represent the temperature range across different locations.
- The chart is animated, allowing for the display of temperature changes over time.
- The chart can be interactive, allowing users to zoom in and out of the map.
- The chart can be used to visualize temperature data for a specific region or for the entire world.
Real-Time Map Dashboard
A real-time map dashboard is a type of chart that displays data on a geographical map in real-time. It allows users to monitor events, make decisions, inform others, and see trends.
Characteristics:
- Displays data on a geographical map: A real-time map dashboard displays data on a geographical map, allowing users to see the location of events and trends.
- Provides real-time data access: A real-time map dashboard provides real-time data access, enabling users to make important decisions as soon as something good or bad happens.
- Offers a comprehensive view of data: A real-time map dashboard offers a comprehensive view of data, providing key insights for at-a-glance decision-making.
- Can be operational, strategic, or analytical: Depending on the user's needs, a real-time map dashboard can be operational, strategic, or analytical.
- Allows for customization: A real-time map dashboard can be customized to fit the user's specific needs, including the ability to show a pie chart for each location or define a custom set of locations.
3D Charts
A 3D series is a chart that serves the purpose of visualizing data in a 3-dimensional scene with camera and different light sources. Users can interact with 3D charts with intuitive mouse and touch interactions.
Characteristics:
- Supports several 3D series types including line series, box series, and point series.
- Depending on the series, admits continuous line strokes and markers
- Optimized series for processing massive amounts of data points
- Supports several UI methods
- Supports different color shading styles
3D LiDAR Park Visualization
The 3D LiDAR Park Visualization chart is a type of 3D chart that displays a 3D object scanned by LiDAR technology.
Characteristics:
- It provides a realistic and detailed view of the scanned object, allowing for a more immersive experience.
- It uses LiDAR technology to capture the object's shape and dimensions, resulting in accurate and precise data.
- It can be used to visualize complex objects such as buildings, landscapes, and even entire cities.
- It is suitable for fast visualization of large datasets, making it ideal for real-time applications.
- It can be customized with various colors, gradients, and patterns to enhance its visual appeal and highlight specific features.
3D LiDAR Topography Visualization
The 3D LiDAR Topography Visualization is a type of chart that provides a 3D representation of a landscape using LiDAR data. LiDAR data visualization is the method of exploration and analysis of different landscapes being represented as 3D dynamically colored visualizations
Characteristics:
- It provides a 3D representation of a landscape using LiDAR data.
- It is suitable for fast visualization of LiDAR data sets in the range of tens of millions of samples, with 3D points or 3D surface.
- It allows for the exploration and analysis of different landscapes.
- It provides a graphical summary of information by representing a set of data through variations in colors.
- It is a type of map chart that allows for the visualization of spatial relationships in data by indicating data on a geographical map.
Intensity Surface Grid Chart
A 3D Intensity Surface Grid Chart is a type of chart that visualizes a data set in the form of a grid, where the intensity of the data is represented by variations in color.
Characteristics:
- The chart is three-dimensional, allowing for a more immersive and detailed representation of the data.
- The intensity of the data is represented by variations in color, with darker colors indicating higher intensity and lighter colors indicating lower intensity.
- The chart is made up of a grid of cells, with each cell representing a data point.
- The chart can be used to represent a wide range of data types, including temperature, elevation, and population density.
- The chart is often used in scientific and engineering applications, such as weather forecasting, geological mapping, and fluid dynamics.
Chunked Surface Grid Chart
A 3D Chunked Surface Grid Chart is a type of chart used to visualize a dataset in the form of a grid. It provides a graphical representation of information by using variations in colors to represent a set of data.
Characteristics:
- The chart is three-dimensional, with the x and y-axes representing the horizontal and vertical dimensions, respectively, and the z-axis representing the data values.
- The chart is made up of a grid of cells, with each cell representing a data point.
- The color of each cell represents the value of the data point it represents.
- The chart can be chunked into sub-sections, which are loaded individually for better performance.
- The chart is useful for visualizing large datasets and identifying patterns or trends in the data.
Surface Partial Invalidation Chart
The 3D Surface Partial Invalidation Chart is a type of chart that displays data points in a three-dimensional space. The chart is designed to show the relationship between three variables, with the x and y-axes representing the first two variables, and the z-axis representing the third variable. The chart is particularly useful for visualizing large datasets and identifying patterns in the data.
Characteristics:
- The chart displays data points in a three-dimensional space, with the x and y-axes representing the first two variables, and the z-axis representing the third variable.
- The chart is designed to show the relationship between three variables, making it particularly useful for visualizing large datasets and identifying patterns in the data.
- The chart can be customized with different colors and shading to highlight specific areas of the data.
- The chart can be interactive, allowing users to zoom in and out and rotate the chart to view it from different angles.
- The chart can be updated in real-time, making it ideal for monitoring changes in the data over time.
Grouped Bars Chart
A grouped bars chart is a type of bar chart that displays numeric values for levels of two categorical variables instead of one. Bars are grouped by position for levels of one categorical variable, with color indicating the secondary category level within each group.
Characteristics:
- It is used to show a distribution of data points or make comparisons across different categories of data.
- It divides data points across two different categorical variables, not just one.
- It can be used to compare two or more pieces of information for each item on the x-axis.
- It is typically formatted into a table with three or more columns, with values down the first column indicating levels of the primary categorical variable.
- It is a variant of a bar chart, with bars grouped by position for levels of one categorical variable, and color indicating the secondary category level within each group.
Horizontal Bar Chart
A horizontal bar chart, also known as a bar graph, column chart, or column graph, is a chart type that represents data using rectangular bars that are drawn horizontally. The length of each bar is proportional to the value it represents.
Characteristics:
- The bars are drawn horizontally, with the x-axis representing the length of each bar.
- The y-axis represents the categories being compared.
- The bars can be stacked to show the relationship of stacks to the whole bar or column and relations between whole bars/columns.
- The chart can be presented as 100%, with the stacks showing a relative part to the whole bar/column in percentages.
- The horizontal bar chart is suitable for displaying comparisons between several categories of data, and the labels are easier to display. It is also more suitable for display on a mobile device in the case of a large data set.
Span Chart
A Span Chart is a chart type that displays the range of data by plotting two Y values per data point. Each Y value used is drawn as the upper and lower bounds of a column/bar.
Characteristics:
- The Span Chart is used to display dataset ranges between a minimum and maximum value.
- It is ideal for comparing ranges, typically between categories.
- The chart shows the maximum and minimum values a data set takes within a given period.
- It is also known as a floating bar graph or difference graph.
- The Span Chart is useful for visualizing the spread of data and identifying outliers.
Build high-performance JS charting applications
GPU-acceleration
Deliver high-performance charting applications that leverage and use CPU resources more efficiently.
Real-time charts
LightningChart JS is designed from the start to serve real-time oriented and performance demanding applications.
Dashboards
Control dozens of charts and UI elements in single interactive dashboards and maximize your app resource-consumption.

Powerful engine
No need to develop workarounds or gimmicks. LightningChart JS works at the highest data visualization performance saving costs and avoiding development delays.
Start development with LightningChart JS
Accelerate development with framework compatibility
LightningChart JS charting components are compatible with more than 10 different frameworks to fasten your app development.
Trusted by world-class leaders
“Our main requirement was to integrate a high-performance plotting library into a web browser-based application. The requirements we were searching for were a live sample rate of 10Hz and the number of maximum points per plot of 6,000,000 samples. In that case, LightningChart JS is the right library for us. The team decided to select LightningChart due to the outstanding plotting performance and easy integrability with our web browser-based tool.”
Sebastian Pfeifer SES S.A. | Software Engineer, Software Systems
As the communication with LightningChart team was really easy and efficient including flexible licensing schemes, we never looked back and LightningChart JS was the clear choice for the charting library.
Jussi LuopajärviTestLogger | Founder & Lead Developer
“At MBBM-VAS, we conveyed pre-selection performance tests, it was how we could observe how LightningChart is shown to consistently outperform its competitors. We selected LightningChart® JS for the large number of data points we wished to present to our users which LightningChart® JS could do without any problems. LightningChart® JS also maintained this edge during all the additional interactivity tests performed.”
Christian GrobauerMüller-BBM VibroAkustik Systeme GmbH | Head of Development
Download LightningChart for Free
LightningChart JS
Ideal for developing highly demanding desktop applications, e.g., scientific, engineering, finance, medicine, etc.
The library features 100+ chart types, signal tools, and examples source code supported in WinForms, UWP, and WPF.
Hardware-accelerated controls for lightning-fast rendering performance and efficient use of resources
If you have any questions, feel free to contact us!
©LightningChart Ltd 2024. All rights reserved.