LightningChart .NETWPF Polar Radar Chart
TutorialLearn how to create a WPF Polar Radar chart with LightningChart .NET
WPF Polar Radar Charts
WPF Polar radar charts are used for visualizing direction and distance data in aeronautics and navigation. In navigation, polar charts may reflect information about a ship’s position, course, and speed.
For example, a polar chart might display the position of a ship to the North Pole while radiating outward lines for speed and course. WPF Polar radar charts are leveraged in navigation to quickly determine a ship’s location and trajectory.
As for aeronautics, polar charts are used to display the performance metrics of an aircraft. Some characteristics could be an aircraft’s lift, drag, changes in airspeed, angle of attack, etc.
This information is mainly used by aircraft designers, engineers, and pilots for building optimized aircraft that respond and adapt to different flying conditions.
Project Overview
Today, you will learn how to make a polar diagram using the WPF framework in LightningChart .NET. WPF will allow us to build an advanced polar chart application and customize it with different UI properties made available by LightningChart.
To get started, download the project template to follow the tutorial.
Download the project to follow the tutorial
Local Setup
For this polar chart project, we need to take in count the following requirements to compile the project.
-
OS: 32-bit or 64-bit Windows Vista or later, Windows Server 2008 R2 or later.
-
DirectX: 9.0c (Shader model 3 and higher) or 11.0 compatible graphics adapter.
-
Visual Studio: 2010-2019 for development, not required for deployment.
-
Platform .NET Framework: installed version 4.0 or newer.
Now go to the next URL and click the download button: http://lightningchart.com/net-charts/
You will be redirected to a sign in form, from then on, the process is very simple to follow. So, after confirming your email, you will have access to your own LightningChart account.
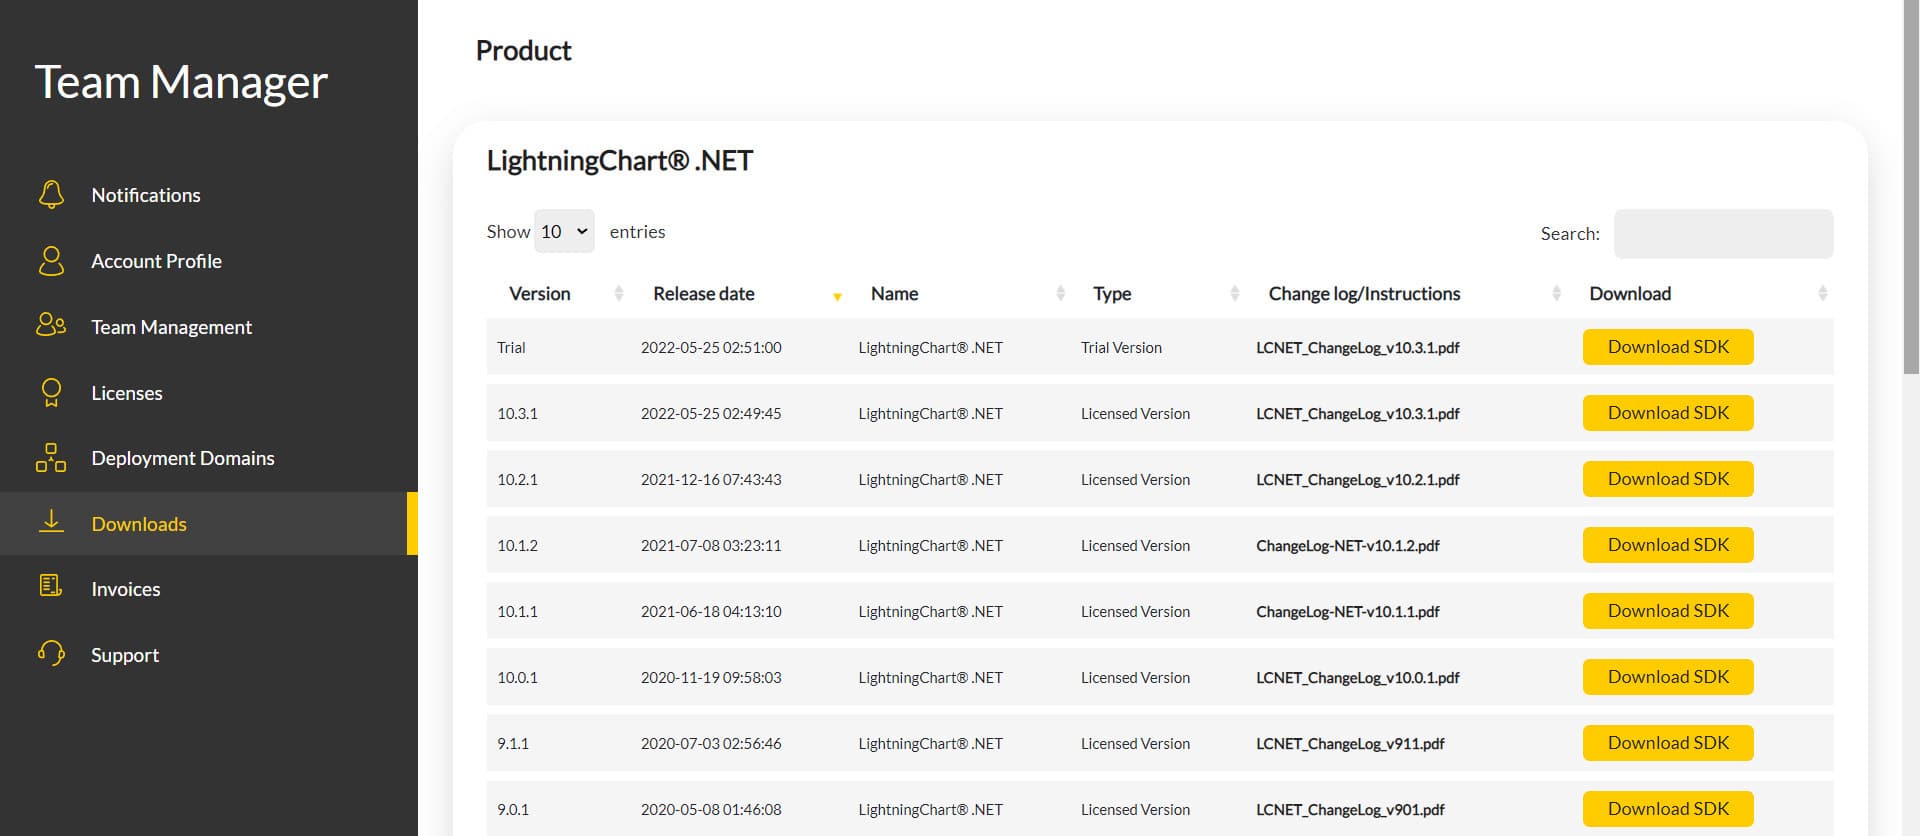
After you sign into your account, you will be able to download the SDK. This SDK will be a "free trial" version, but you will be able to use many important features.
If you download the SDK, you will have an .exe like this:
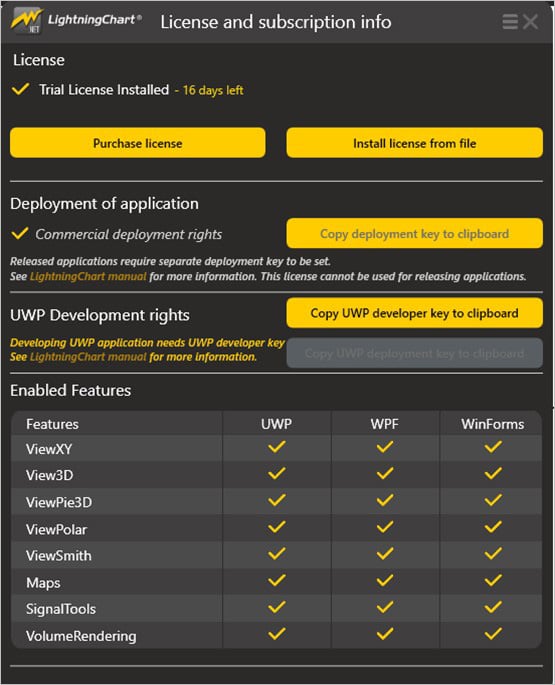
The installation will be a typical Windows process, so please continue with it until it is finished. After the installation, you will see the following programs:

- License Manager: In this application, you will see the purchase options. All the projects that you will create with this trial SDK, will be available for future developments with all features enabled.
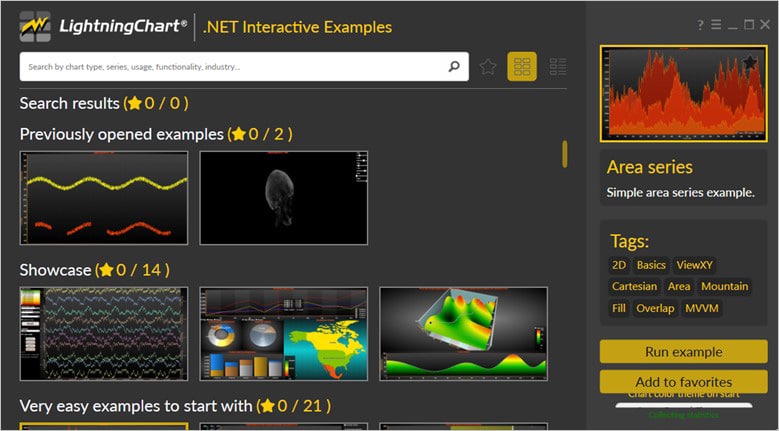
- LightningChart .NET Interactive Examples: now you can see 100+ interactive visualizations available for WPF, WinForms, and/or UWP though today we’re working with Smith Charts.
Visual Studio Project
Now let’s work with visual studio. The main difference between using the LightningChart .NET visualizer and Visual Studio, is that we will be able to analyze and experiment with many features in the source code. In the LC visualizer, select the Polar Radar chart and run the example:

In the top-right zone of the windows, you will see the following options:
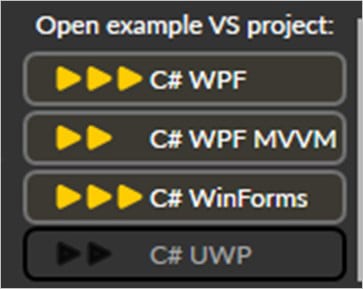
For trial SDK, we will be able to use the WPF and WinForms frameworks. If you are fully related to windows forms, this option will be more comfortable. In this case I will use the Windows Presentation Foundation framework.
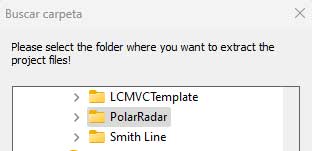
After clicked the framework to use, we will need to specify a folder where the project will be created:
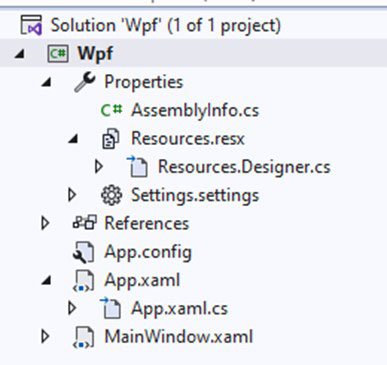
Finally, the project will be created, and the Visual Studio will be opened and ready for execution.
Code Review
The main code will be wrapped inside MainWindow.xaml.cs. Here we will find the code for UI controls.
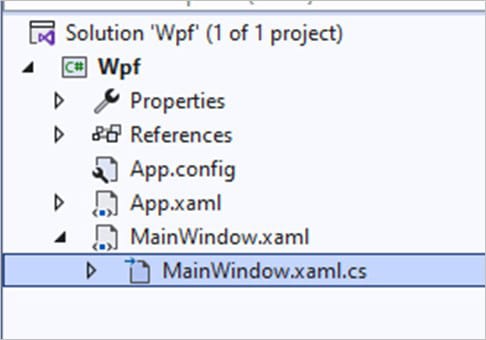
Inside the code we will check two methods that will create the properties that we need to draw correctly the chart.
CreateChart()
This main method will initialize many properties that are provided by the Lightning Chart .NET framework. The great advantage here is, if you have C# knowledge, this syntax will be easier for you.
_chart:
The chart object will contain the LightningChart constructor… basically, this will contain a new instance of a chart object.
_chart = new LightningChart();BeginUpdate:
Enabling this option suspends control repainting while modifying a property. It is advisable to use this when there are multiple property updates or when updating series points.
_chart.BeginUpdate();Disabling mouse interaction:
To avoid overloading the CPU, it is advisable to disable user interactions while updating the object, as keeping the user interacting with the mouse could lead to performance issues.
_chart.Options.AllowUserInteraction = false;Set chart type: Polar chart = ViewPolar.
_chart.ActiveView = ActiveView.ViewPolar;Name and title for the chart: RangeKm = 20.0
_chart.ChartName = "ChartPolarRadar";

            _chart.Title.Text = "Scanning radar chart, radius " + RangeKm.ToString() + " km";
Configuring the polar axis:
AxisPolar axis = _chart.ViewPolar.Axes[0];
            axis.MajorGrid.Visible = true;
            axis.MinorGrid.Visible = true;
            axis.TickMarkLocation = RoundGridTickmarkLocation.Outside;
            axis.AngularReversed = true;
            axis.InnerCircleRadiusPercentage = 0;
            axis.MajorDivCount = 4;
            axis.MinAmplitude = 0;
            axis.MaxAmplitude = RangeKm;
            axis.AllowScaling = true;
            axis.AllowScrolling = true;
            axis.Title.Visible = false;
            axis.Visible = true;
            axis.Units.RadialOffsetPercentage = 100;
            axis.AmplitudeAxisLineVisible = false;
            axis.LabelsFont = new WpfFont(new System.Drawing.FontFamily("Segoe UI"), 25.0, System.Drawing.FontStyle.Regular);
            axis.MinorGrid.Visible = false;
            axis.GridAngular.Visible = true;
            axis.AngleOrigin = -90;
            axis.AngularAxisCircleVisible = false;
            axis.GridAngular.Color = Color.FromArgb(50, 0, 160, 120);
            axis.GridAngular.LineWidth = 2;
            axis.MajorGrid.Color = Color.FromArgb(50, 0, 160, 120);
We can access a specific Axis of the WPF polar radar chart object by using the Axes array object. Once we have an instance of the AxisPolar chart, we can proceed to update the UI properties.
Polar axes can be defined via the Axes list property. Several axes can be used in the same chart. Series can be assigned with any of these axes by setting the AssignPolarAxisIndex property of a series.
An axis represents both the angular scale and amplitude scale. Otherwise, the polar axes are very similar to the ViewXY axes.
- MajorGrid/MinorGrid: Vertical division ticks are marked with horizontal grid lines. The major grids correspond to the major division ticks, while the minor grids correspond to the minor division ticks. To modify the grids’ appearance, you can utilize the MajorGrid and MinorGrid properties.
- TickMarkLocation: Round grid mark location concerning the circle of the polar diagram.
- AngularReversed: The axis angle direction is reversed. If false, the angles increase counterclockwise. If true, they increase in a clockwise direction. Does not affect the amplitude axis in any way.
- The axis can be reversed by amplitude, angle, or both. To reverse the angle scale, set AngularReversed = True.
- To reverse the amplitude scale, set AmplitudeReversed = True.
- InnerCircleRadiusPercentage: The inner circle radius is a percentage of the full circle.
- MajorDivCount/MinorDivCount: Set the amplitude division count with MajorDivCount and division magnitude with MajorDiv property.
- The amplitude scale will adjust accordingly (updating MaxAmplitude). Set amplitude minor division count with MinorDivCount.
- RadialOffsetPercentage: Radial offset of title as a percentage.
- 0 = axis begin, 100 = axis end. This affects first then RadialOffsetPixels.
- AmplitudeAxisLineVisible: Shows amplitude axis.
Removing any existing Point Line Series:
_chart.ViewPolar.PointLineSeries.Clear();Creating a new Point Line Series:
PointLineSeriesPolar can be used to draw a line, a group of points, or a point line. Lots of line and point styles are available in LineStyle and PointStyle properties.
PointLineSeriesPolar directionVec = new PointLineSeriesPolar(_chart.ViewPolar, axis);
            directionVec.LineStyle.Width = 3;
            directionVec.LineStyle.Color = Colors.White;
            directionVec.AllowUserInteraction = false;
            _chart.ViewPolar.PointLineSeries.Add(directionVec);
Creating the sector:
Sectors can be defined to indicate some angular or amplitude range. Define amplitude range with MinAmplitude and MaxAmplitude properties. Define angular range with BeginAngle and EndAngle.
The sector is created as an image with a gradient. To give a radar effect, we can add a transparent style. The gradient color is created with the CalcGradient tool. This tool calculates the gradient, using two colors.
private const int SectorCountInSweep = 45;

for (int iSector = 0; iSector < SectorCountInSweep; iSector++)
            {
                Sector sector = new Sector(_chart.ViewPolar, axis)
                {
                    Behind = true,
                    MinAmplitude = 0,
                    MaxAmplitude = RangeKm
                };
                sector.BorderlineStyle.Width = 0;
                sector.BorderlineStyle.Color = Colors.Transparent;
                sector.Fill.GradientFill = Arction.Wpf.Charting.GradientFill.Solid;
                sector.Fill.Color = ChartTools.CalcGradient(SweepColorBegin, SweepColorEnd, 100.0 * iSector / SectorCountInSweep);
                sector.ShowInLegendBox = false;
                sector.AllowUserInteraction = false;
                _chart.ViewPolar.Sectors.Add(sector);
            }
Moving objects & screen coordinates
Updating moving objects to correct screen coordinates based on their polar angle and amplitude information. The moving objects will be created and stored in a List object.
_chart.SizeChanged += _chart_SizeChanged;Creating moving objects
_chart.AfterRendering += _chart_AfterRendering;We need to create MovingObject objects after the chart has been rendered because the MovingObject constructor uses the AxisPolar.CoordToValue method which does not work correctly until the chart has been rendered.
The moving objects will be created under the total of MovingObjectCount(10). We need to set the coordinates that can be rendered inside the WPF Polar radar chart. To get the diameter and center of axes, we need to use the tool GetChartDiameterAndCenter.
Those values will be used with random numbers to create random coordinates. If you need specific coordinates, you will have to use real double values.
private void CreateMovingObjects()
        {
            m_listMovingObjects.Clear();

            Random rand = new Random();
            int iCenterX = 0, iCenterY = 0, iDiameter = 0;

            _chart.ViewPolar.GetChartDiameterAndCenter(out iDiameter, out iCenterX, out iCenterY);

            for (int i = 0; i < MovingObjectCount; i++)
            {
                int iCoordX = iCenterX - iDiameter / 4 + (int)(rand.NextDouble() * iDiameter / 2);
                int iCoordY = iCenterY - iDiameter / 4 + (int)(rand.NextDouble() * iDiameter / 2);

                double dKph = 500 + rand.NextDouble() * 1500.0; //Simulate jet fighter speeds

                m_listMovingObjects.Add(new MovingObject(_chart.ViewPolar, iCoordX, iCoordY,
                    m_stopWatchTimelineAnimation.ElapsedMilliseconds / 1000.0, rand.NextDouble() * 360.0, dKph, SweepTime * 2.0));
            }
        }
Ending update: add the chart to the grid and restart the animation
_chart.EndUpdate();

            _chart.Loaded += _chart_Loaded;

            gridChart.Children.Add(_chart);
Start();- EndUpdate: Enables control repainting, and refreshes the control.
- _chart_loaded: Reset palette if the ColorTheme is used.
Start:
if (IsRunning == false)
            {
                m_stopWatchTimelineAnimation.Restart();
                _timerScanUpdater.Start();


}- StopWatch: Provides a set of methods and properties that you can use to accurately measure elapsed time.
- Restart: Stops time interval measurement, resets the elapsed time to zero, and starts measuring elapsed time.
- DispatcherTimer (_timerScanUpdater): A timer that is integrated into the System.Windows.Threading.Dispatcher queue which is processed at a specified interval of time and at a specified priority.
- Start(): Starts the System.Windows.Threading.DispatcherTimer.
Final Application
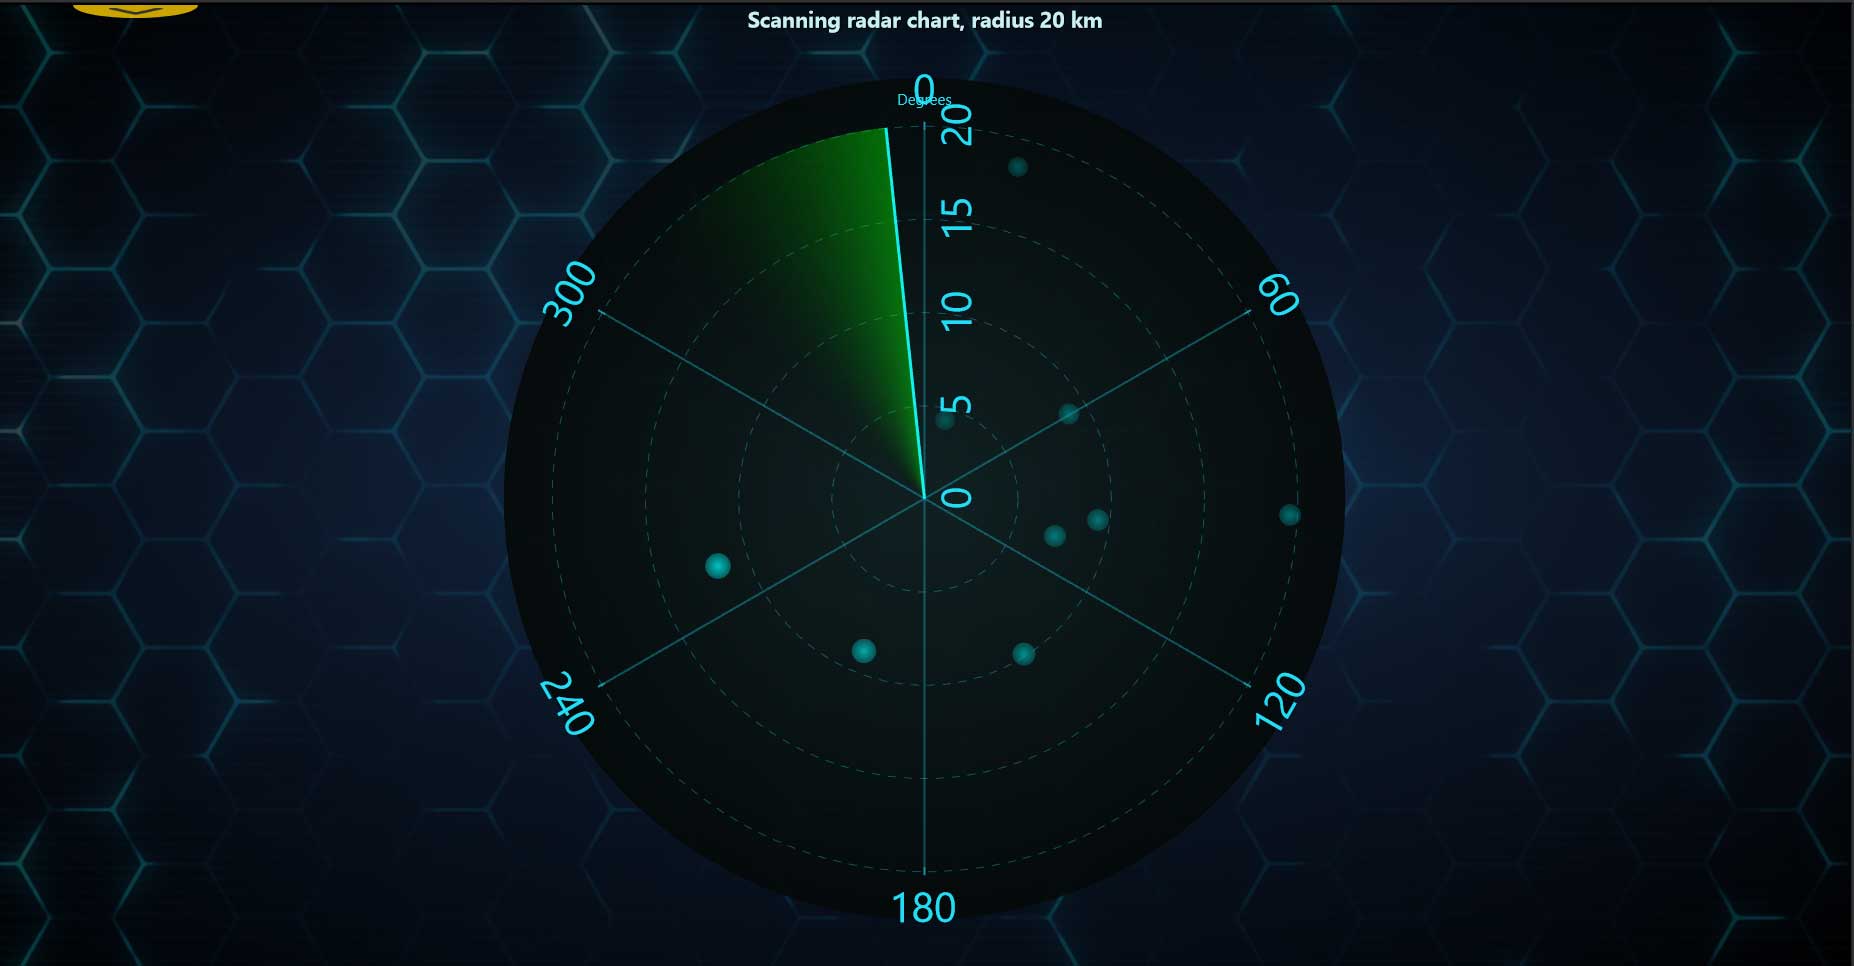
Here’s the final WPF polar radar chart application:
In conclusion, creating a WPF polar radar chart with LightningChart .NET is an efficient and user-friendly way to visualize complex data. With its intuitive interface and customizable features, LightningChart .NET provides users with the tools necessary to create professional-quality charts for a wide range of industries.
The polar radar chart is particularly useful in industries such as meteorology, where it can be used to display weather data such as wind speed and direction, or in the aerospace and defense industry, where it can be used to display information about radar signals and their direction.
See you in the next article!

