LightningChart .NETSignal Persistent Intensity Chart
TutorialLearn how to create a WPF Signal Persistent Intensity Chart application with LightningChart .NET
WPF Signal Persistent Intensity Chart
Hello! Today we’re deepening into how to create an intensity series application commonly used in Digital Signal Processing. So, the Signal Persistent Intensity chart shows a time-varying representation of the intensity (magnitude) of signal data. You can expect to use this type of chart in audio processing, image processing, and video analysis.
A Signal Persistent Intensity chart involves analyzing signal data over time. The intensity of the signal at each data point in time is captured and represented visually, e.g., as a heatmap. A Signal Persistent Intensity chart is useful in different contexts, including detecting changes in signal characteristics, identifying patterns within signal data, or visualizing the behavior of the signal over time.
Project Overview
This type of chart is also known as Persistent Spectrum, and we’ll use it to represent the frequency present in a specific signal over a period of time. In further analysis, you can plot your data and identify hidden patterns within the signal.
For this, you can try to identify those patterns that look brighter and longer persistent than the rest of the data. So, let’s now create our own Signal Persistent Intensity chart using LightningChart .NET.
Download the project to follow the tutorial
Local Setup
For this polar chart project, we need to take in count the following requirements to compile the project.
-
OS: 32-bit or 64-bit Windows Vista or later, Windows Server 2008 R2 or later.
-
DirectX: 9.0c (Shader model 3 and higher) or 11.0 compatible graphics adapter.
-
Visual Studio: 2010-2019 for development, not required for deployment.
-
Platform .NET Framework: installed version 4.0 or newer.
Now go to the next URL and click the download button: http://lightningchart.com/net-charts/
You will be redirected to a sign in form, from then on, the process is very simple to follow. So, after confirming your email, you will have access to your own LightningChart account.
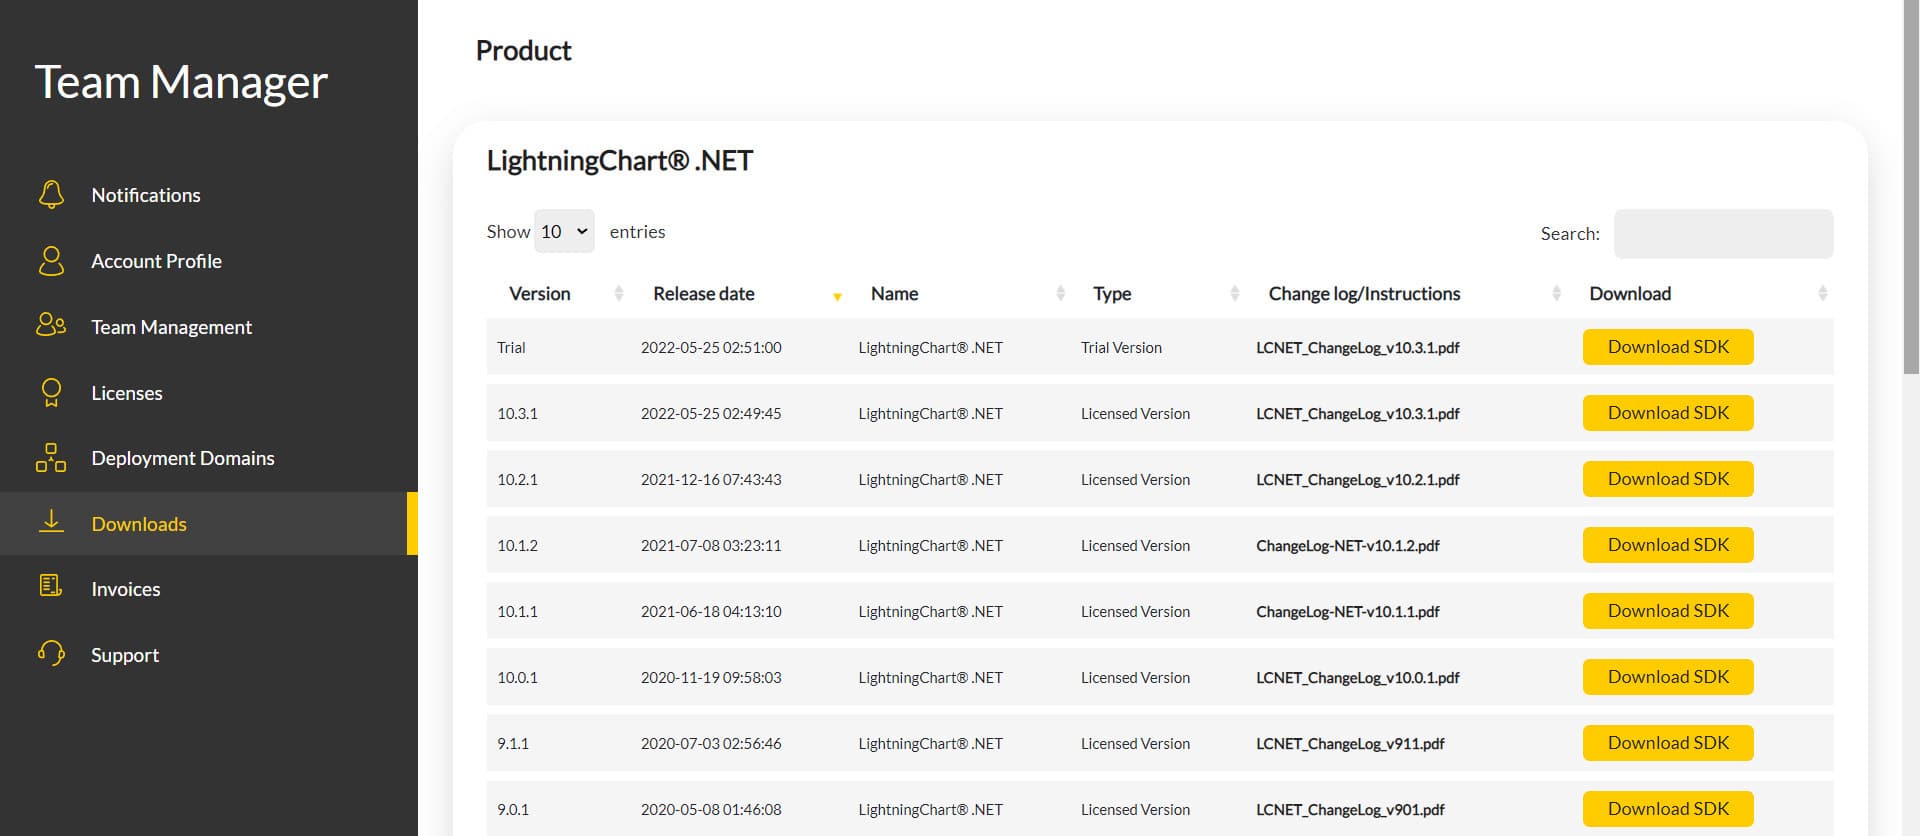
After you sign into your account, you will be able to download the SDK. This SDK will be a "free trial" version, but you will be able to use many important features.
If you download the SDK, you will have an .exe like this:

The installation will be a typical Windows process, so please continue with it until it is finished. After the installation, you will see the following programs:

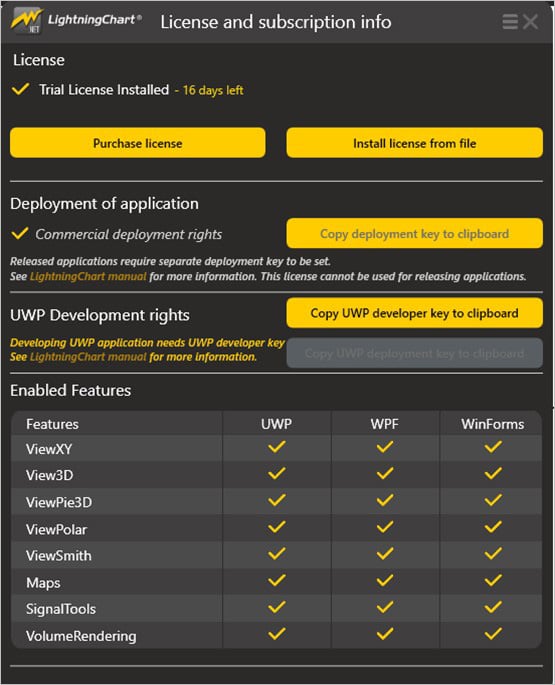
- License Manager: In this application, you will see the purchase options. All the projects that you will create with this trial SDK, will be available for future developments with all features enabled.
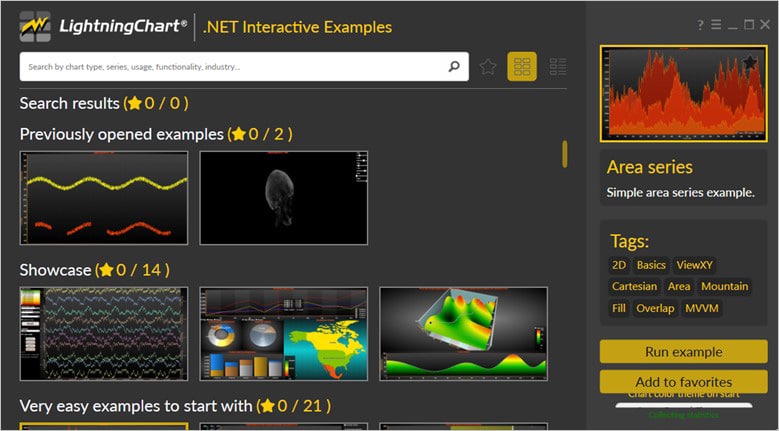
- LightningChart .NET Interactive Examples: now you can see 100+ interactive visualizations available for WPF, WinForms, and/or UWP though today we’re working with Smith Charts.
Visual Studio Project
Now let’s work with visual studio. The main difference between using the LightningChart .NET visualizer and Visual Studio, is that we will be able to analyze and experiment with many features in the source code. In the LC visualizer, select the Signal Persistent Intensity Chart and run the example:

In the top-right zone of the windows, you will see the following options:
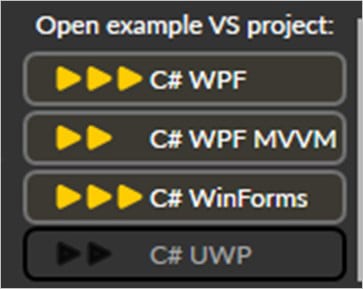
For trial SDK, we will be able to use the WPF and WinForms frameworks. If you are fully related to windows forms, this option will be more comfortable. In this case I will use the Windows Presentation Foundation framework.
After clicked the framework to use, we will need to specify a folder where the project will be created:
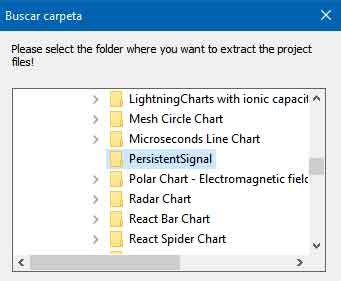
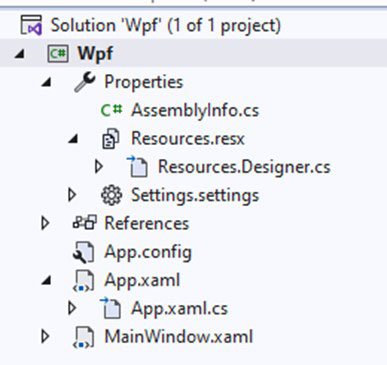
Finally, the project will be created, and the Visual Studio will be opened and ready for execution.
Code Review
The main code will be wrapped inside MainWindow.xaml.cs. Here we will find the code for UI controls.
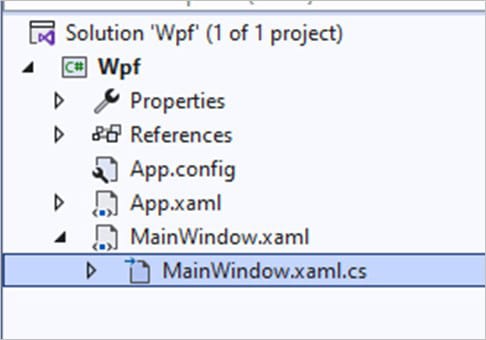
Inside the code we will check two methods that will create the properties that we need to draw correctly the chart. The interactive example is built with various user controls, to manipulate and change the visual properties of the chart. These controls are not required to generate this graph, so we will focus on the code responsible for generating the object.
CreateSignalGenerator()
SignalGenerator class and add the following properties://Generator A
_generator = new SignalGenerator
{
Name = "generatorA",
SamplingFrequency = (int)SamplingFrequency,
OutputInterval = 2,
ThreadType = ThreadType.Thread,
ThreadInvoking = false
};- Name: defines the name of the object.
- SamplingFrequency: Gets or sets the sample rate, that is, the number of output points generated per second.
- OutputInterval: Gets or defines the output interval of the signal generator. This is measured in milliseconds.
- ThreadType: Gets or sets the way how the data are generated. Generates data by using a thread or a synchronized timer from the main UI thread.
- ThreadInvoking: Built-in call to the UI thread when using ThreadType = Thread.
Now, we need to set the collection of sine waveform components:
_generator.WaveformSines.Add(new SineComponent() { Amplitude = 50, Frequency = 150 });
            _generator.WaveformSines.Add(new SineComponent() { Amplitude = 11, Frequency = 75 });
            _generator.WaveformSines.Add(new SineComponent() { Amplitude = 7, Frequency = 50 });
            _generator.WaveformSines.Add(new SineComponent() { Amplitude = 6, Frequency = 0.5 });
Now we need to configure a collection of random noise for the waveform components:
_generator.WaveformRandomNoises.Add(new RandomNoiseComponent() { Amplitude = 1 });

            _generator.DataGenerated += _generator_DataGenerated;
            _generator.Started += _generator_Started;
_generator.Stopped += _generator_Stopped;_generator_DataGenerated and putSamplestoChart functions:private void _generator_DataGenerated(DataGeneratedEventArgs args)
{
Dispatcher.Invoke(_putSamplesToChart, args.Samples, args.FirstSampleTimeStamp);
}
private void PutSamplesToChart(ref double[][] samples, double firstSampleTimeStamp)
{
if (_chart == null)
{
return;
}When the data generation has started, the process of creating data points for the signal persistent intensity chart will begin. This will be calculated based on the value of the sampling frequency specified in the SamplingFrequency variable.
private void _generator_Started(StartedEventArgs args)
        {
            Dispatcher.Invoke(new System.Action(HandleGeneratorStart));
        }

        private void HandleGeneratorStart()
        {
            _oldSamples = null;

            _chart.BeginUpdate();

            //Calculate points / trace count
            _pointsPerTrace = (int)(Math.Round((_chart.ViewXY.XAxes[0].Maximum - _chart.ViewXY.XAxes[0].Minimum)
                * _generator.SamplingFrequency)) + 1;

            _chart.ViewXY.SampleDataSeries[0].SamplingFrequency = _generator.SamplingFrequency;

            ClearPersistentLayer();

            _chart.Title.Text = "Persistent intensity signal monitor, " + _generator.SamplingFrequency.ToString() + " samples/sec";
If the generator is stopped by the user, the chart and all its properties will be disposed of:
private void PerformDisposing()
        {
            if (_historicDataLayer != null)
            {
                _historicDataLayer.Dispose();
                _historicDataLayer = null;
            }

            // Don't forget to clear chart grid child list.
            gridChart.Children.Clear();

            if (_chart != null)
            {
                _chart.Dispose();
                _chart = null;
            }
CreateChart()
This main method is responsible for creating the Signal Persistent Intensity chart object. We begin by creating a new instance of LightningChart and giving the chart a name.
Naming the chart object
_chart = new LightningChart
            {
                ChartName = "Persistent signal chart"
            };
BeginUpdate()
This property disables control repaints when a property is changed. It’s recommended to use it for updating the status of several properties as well as for updating series points.
_chart.BeginUpdate();LegendBox
Adds and configures legend boxes within the chart object. Notice that the legend will be automatically populated by the values created on the chart. So, you’ll only need to specify its orientation and XY position.
_chart.ViewXY.LegendBoxes[0].ShowCheckboxes = false;
            _chart.ViewXY.LegendBoxes[0].Layout = LegendBoxLayout.Vertical;
            _chart.ViewXY.LegendBoxes[0].Offset = new PointIntXY(-15, -70);
Y-axis Configuration
The range numbers will set the Y limits for the signal persistent intensity chart. In this case, minus one hundred (-100) would be the lowest position allowed. The text will be the label displayed on the Y axis, just like this:

_chart.ViewXY.YAxes[0].SetRange(-100, 100);
            _chart.ViewXY.YAxes[0].Title.Text = "Amplitude, V";
X-axis Configuration
_chart.ViewXY.XAxes[0].SetRange(0, 0.01);
            _chart.ViewXY.XAxes[0].ValueType = AxisValueType.Number;
            _chart.ViewXY.XAxes[0].ScrollMode = XAxisScrollMode.None;
            _chart.ViewXY.XAxes[0].FormatValueLabel += ExamplePersistentIntensitySignal_FormatValueLabel;
            _chart.ViewXY.XAxes[0].Title.Text = "Trace time, ms";
            _chart.ViewXY.XAxes[0].AutoDivSpacing = false;
            _chart.ViewXY.XAxes[0].MajorDiv = 0.001;
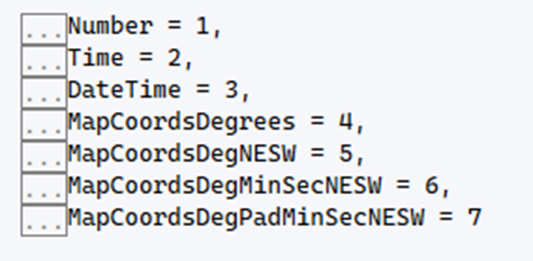
First, we need to set the range limits for the X-axis. The axis will be a number type, but we can choose between other types:
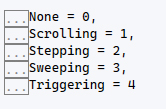
For scrolling, we can select one of the available behaviors:
Title.Text:

Adding a sample data series
To create a series, we need to specify the Y and X axes of our chart. The stroke should not be displayed but it should be only used for rendering on the persistent intensity layer.
SampleDataSeries trace = new SampleDataSeries(_chart.ViewXY, _chart.ViewXY.XAxes[0], _chart.ViewXY.YAxes[0])
            {
                Visible = false
            };
Adding UI properties
The sampling Frequency by default is set to 10000.0 (this value was declared at the beginning of the project). To add this series, we need to add the collection to the SampleDataSeries list. We can add many collections to the list.
trace.Title.Text = "Historic";
            trace.ShowInLegendBox = false;
            trace.LineStyle.Width = 5;
            trace.LineVisible = true;
            trace.SamplingFrequency = SamplingFrequency;
            trace.FirstSampleTimeStamp = 0;
            trace.PointsVisible = false;
            _chart.ViewXY.SampleDataSeries.Add(trace);
EndUpdate()
Once we configure all the properties for our signal, we need to finalize the update. The EndUpdate function enables control repainting and refreshes the control.
_chart.EndUpdate();Adding chart object
Finally, we need to add the chart object to the gridChart XAML element.
gridChart.Children.Add(_chart);Final Application
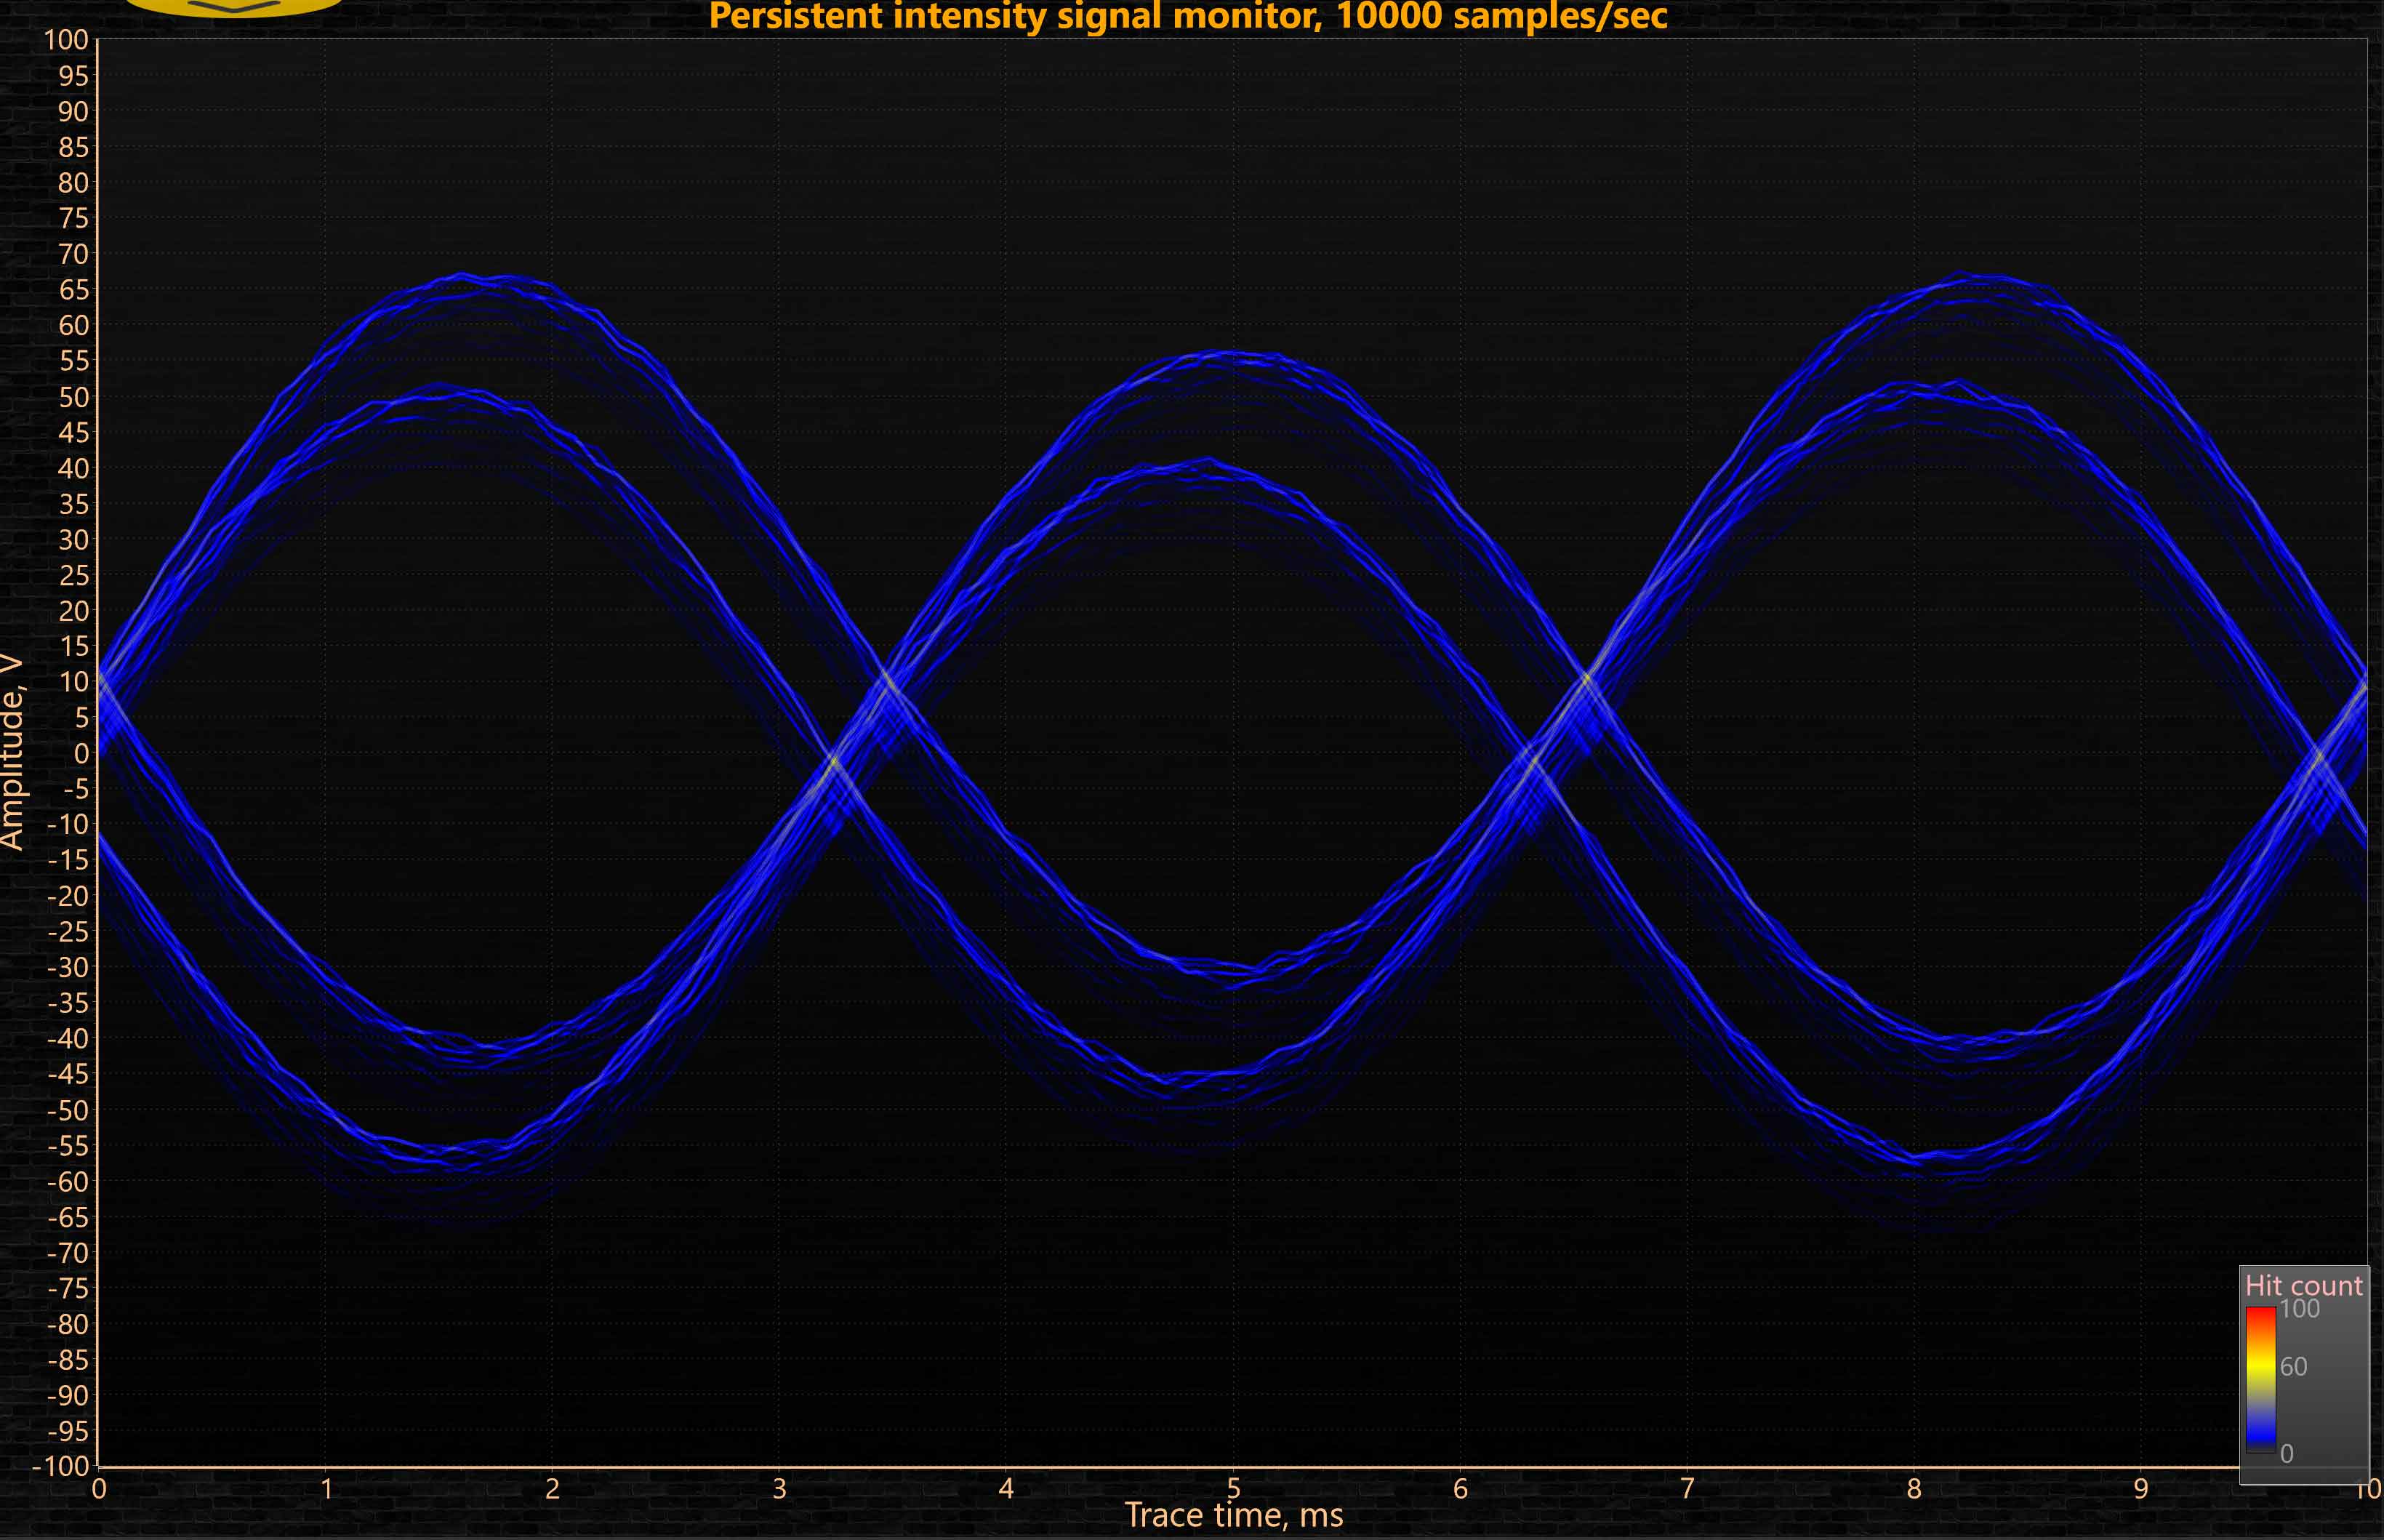
Here’s the final WPF Surface Mesh chart:
As a developer unfamiliar with the study of sine wave signals, I must admit that before I began studying this signal persistent intensity chart, I thought it would be difficult to explain the logic of the code. It was a big surprise to realize that lightning charts managed to get quite a friendly implementation.
We need to make use of an XY chart, create an instance of SampleDataSeries, assign properties, and assign the collection to our chart. Doing this with real data in a dynamic process would increase the complexity of the data mapping, but in the end, the chart creation would be the same.
Working on this article, I got many ideas on how to implement this type of chart, applying data obtained by signal sensors. I guess the biggest concern would be getting the values from a sensor because LightningChart does the other half of the job.

