WinForms chart
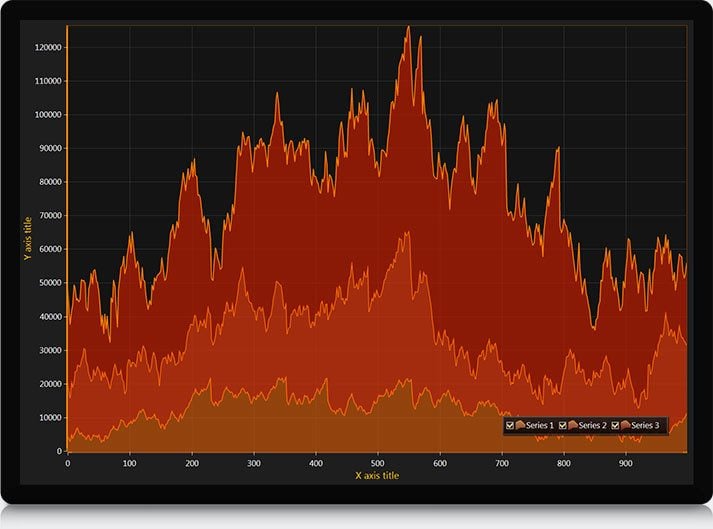
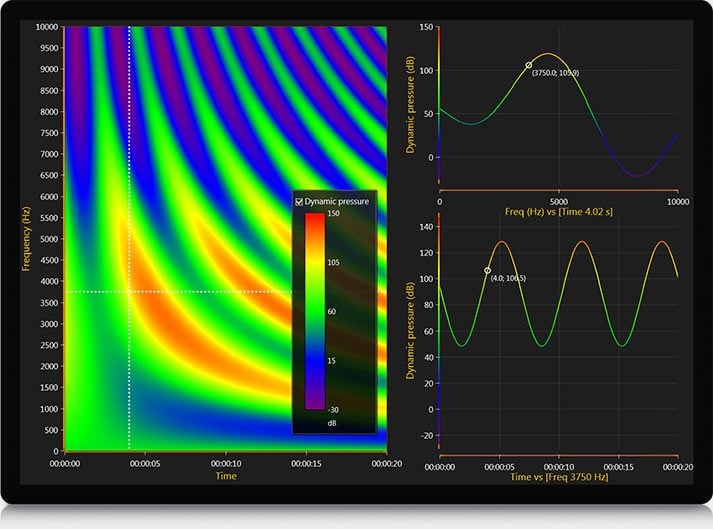
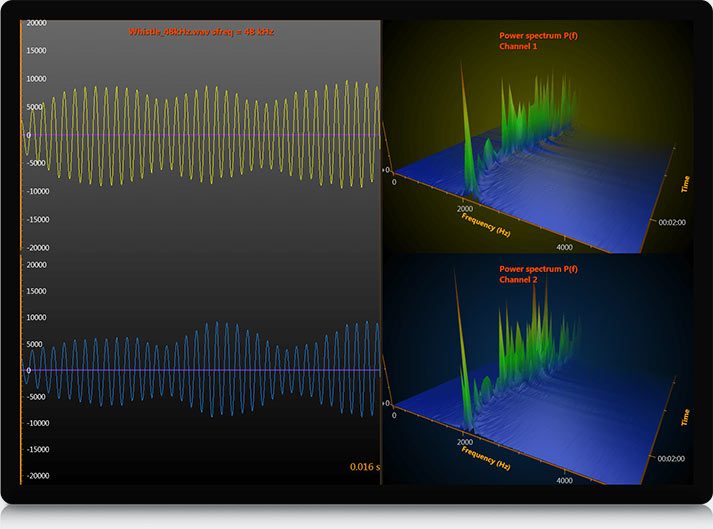
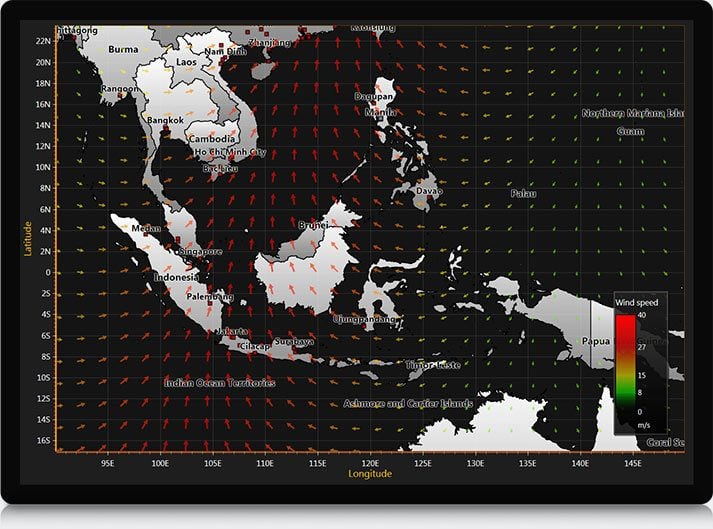
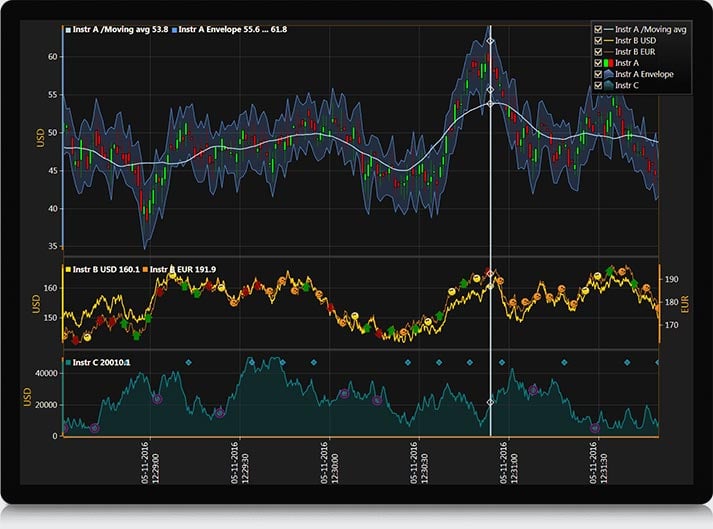
LightningChart for Winforms – the most powerful data visualization solution for .NET in the industry. WinForms chart with LightningChart can be rendered as line charts, scatter charts, bar charts, 3D charts, contour charts, heat map charts, area charts, polar charts, pie charts, candle-stick trading charts and many other chart types. LightningChart gives special attention to the geographic applications and comes with online and offline maps support out of the box.
WinForms chart can be installed into Microsoft Visual Studio toolbox and added in software project by mouse or code. WinForms charts are commonly used as part of Windows desktop applications’ UI, and thus they are an essential add-on components for a software developer.
LightningChart for WinForms uses custom DirectX rendering routines instead of relying on GDI/GDI+ graphics, which makes the performance stand out from the competition by any other WinForms charts.
LightningChart .NET comes with the WinForms chart and provides easy-to-use and fully customizable tools for financial data visualization, business dashboards, engineering, and even rendering of complex 3D scenes with multiple meshes and lighting – all in a form of the fastest WinForms charts on the market!
LightningChart Features:
- Superior 2D and 3D rendering performance
- Full GPU acceleration
- Real-time data monitoring optimization
- Massive data set support
- Audio I/O components included
- Touchscreen compatibility
LightningChart .NET
Do you need advanced .NET data visualization components? Take a look at LightningChart .NET charts, the fastest and most advanced WPF, UWP & WinForms data visualization toolkit ever made.
If you have any questions, feel free to contact us!