LightningChart® JavaScript v3.1.0: Release
Map Charts Release
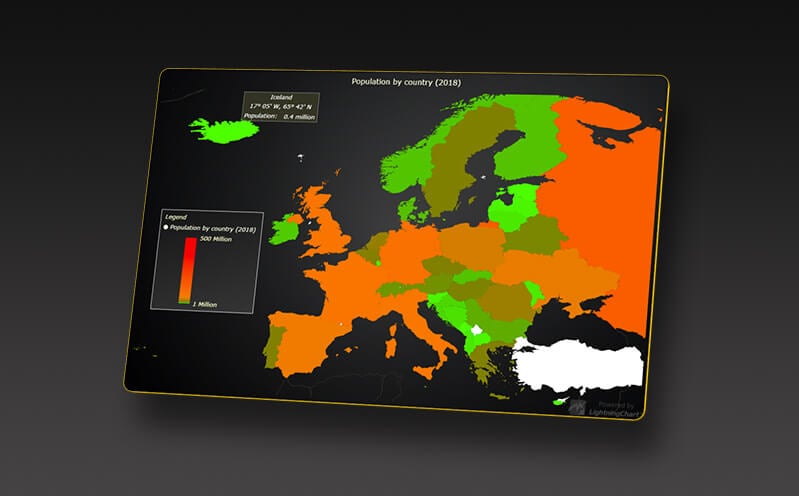
As seen, the map charts can be colored with a single color for the entire map or can dynamically adjust their color according to regions and/or data values.


Figure 2. Map Charts integrated in a dashboard
Other features of Map Charts

- Worldwide
- USA
- North America
- South America
- Canada
- Europe
- Asia
- Africa
- Australia
Time & Precision Features
Additional characteristics have been added to Map Charts in terms of timing and UX precision. Time Tick Strategy enables visually appealing ticks for depicting time intervals in ranges starting from nanoseconds up to several days intervals.
With the high-precision Axis XY feature, LightningChart JS allows zooming up to individual nanoseconds precision. This feature can be toggled on when creating Axis or charts.
Heatmaps charts
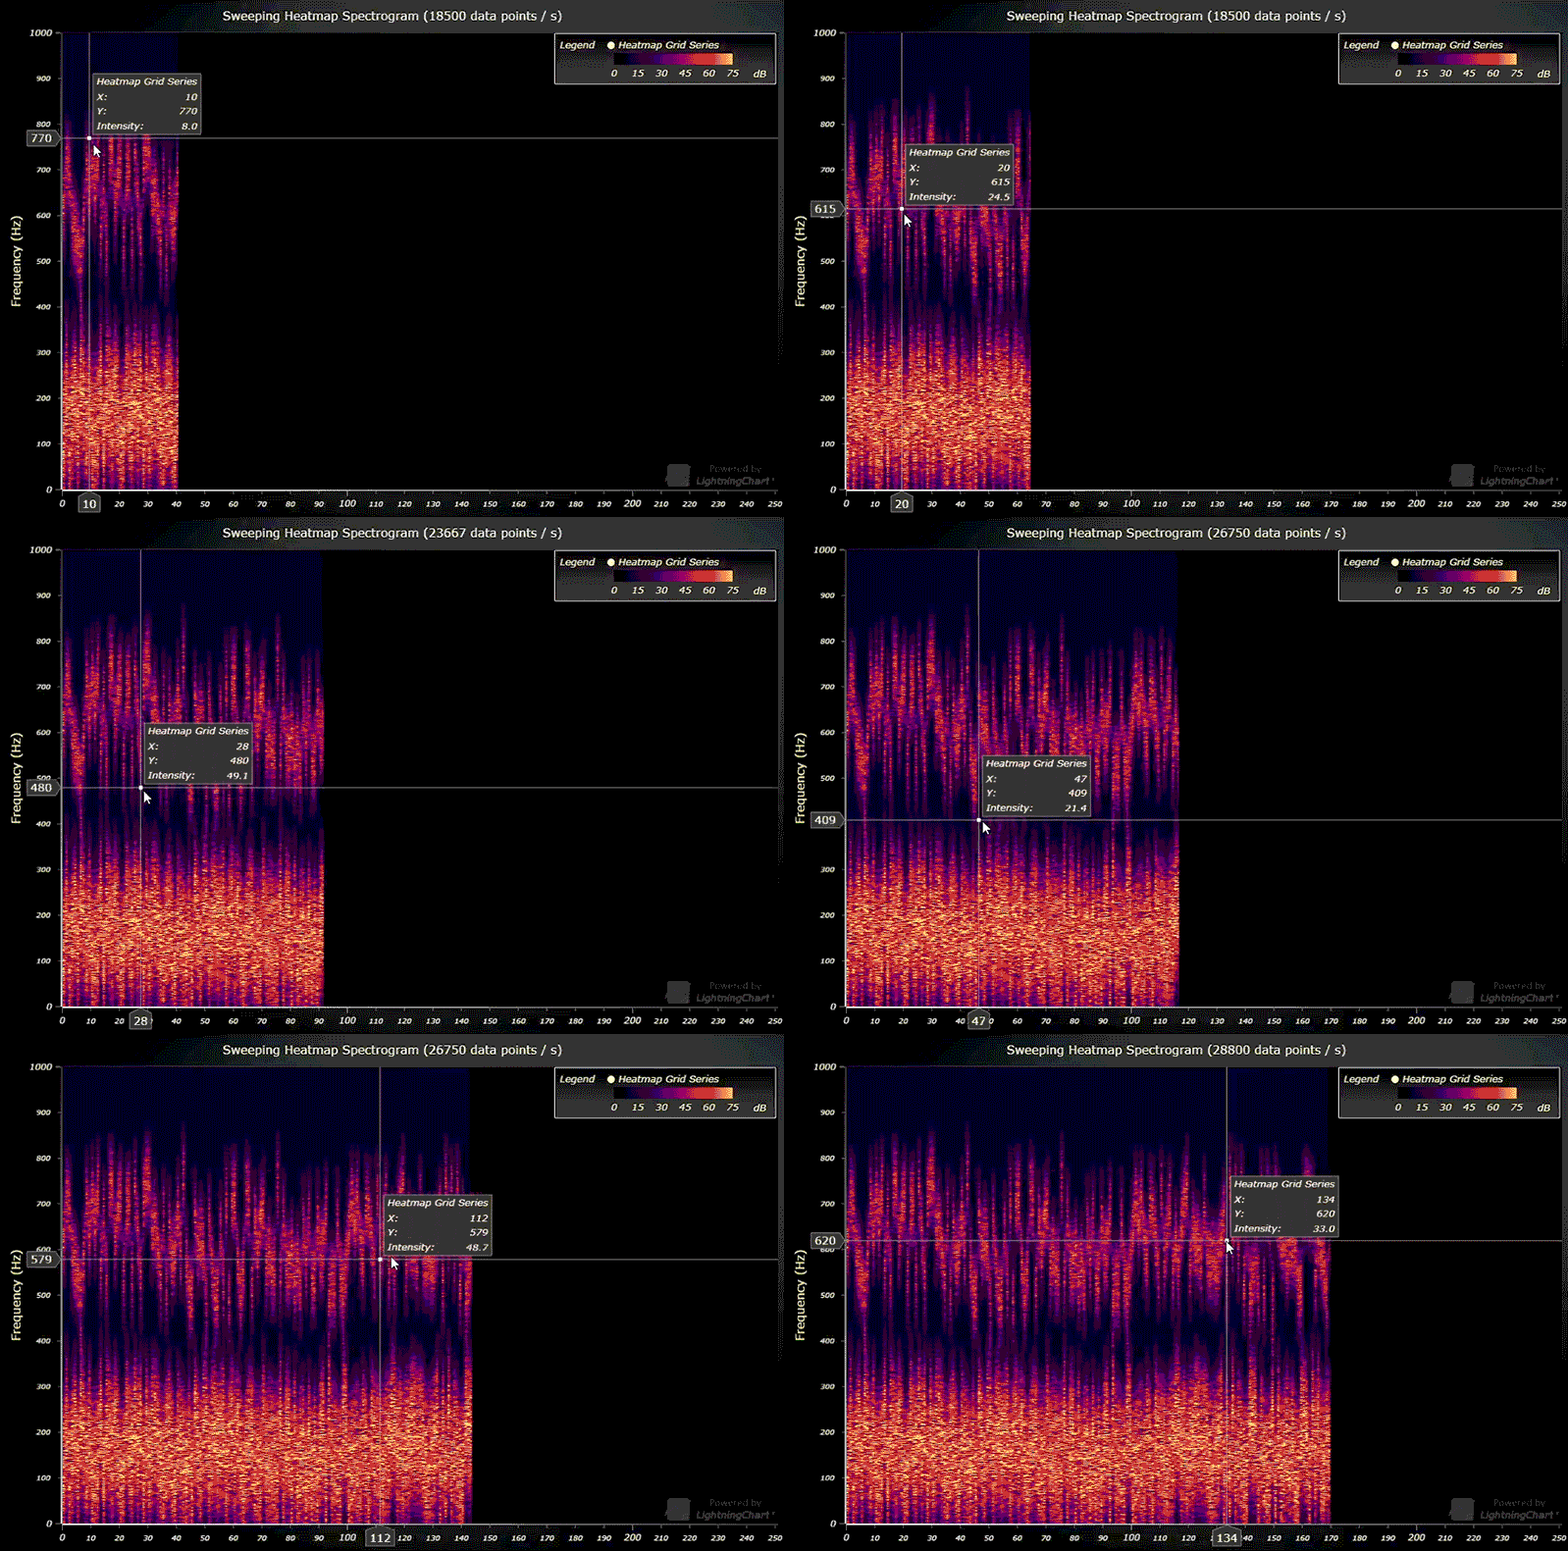
LightningChart® JS v.3.1.0 optimizes heatmaps as well. Grid series are better now and the massive performance improvement of the Heatmaps charts brings desktop performance levels to web applications!
Heatmaps can now support high-performance Axis-scrolling.

Other Improvements
- Time & Precision Features
- Resource-efficient rendering of all charts in one GPU scene
- On-screen menus
- Triggering the most-used actions within charts is now easier with improved UI on-screen menus for zooming, disabling animations, fitting charts, etc.
- Users can now add custom functionalities to these buttons by linking custom-made buttons to the API already available within the charts.
- Text rotation it is now possible from any text-angle including axis tick labels.
- Colored 3D Points
- Improvements have been made on Color by XYZ lookup, Color by Value lookup, Individual point size, and Individual point color.
- Improvements on 3D Coloring
- The default look appearance has been embellished.
- Added Simple Shading style which can be useful and which by default improves look of Surface Series.
- UI Element Auto-Dispose
- This element improves the mobile responsive experience by automatically disposing UI elements if the screen size becomes too small.
- This feature can be toggled on/off.
- Theme changes
- Brand new themes are available for you to use. Some themes may replace old versions, but these will still be usable until LightningChart® JS next major release.
- React users can now enjoy from fixes towards memory leaks.
- The Scissor area issue is now fixed (reported by React users).
Interactive Examples
New examples have been added to the interactive examples and additional features are now introduced:
- Time Tick Strategy
- Time Tick Strategy Scrolling
- High Precision Axis
- Zooming to microseconds level
- Confidence ellipse 2D example
- Polygon Series usage
- Used in statistics
- Custom lasso interaction
- Example shows users how to create custom interactions on XY data.
- Dashboard fiber analysis
- “Distance intensity Chart”
- Example for how our Chart can be used in cable/fiber analysis/monitoring field
- Spectrogram projection
- Sweeping Heatmap grid
- Heatmap pixel interpolation
- Map Chart
- Map Chart with Dynamic Color
- Map Chart Animated
Learn more about LightningChart® JS v.3.1.0
