LightningChart .NET v.10.3.2 has been released!
More performance, more features, and new pricing.
New features added to the TradingChart control
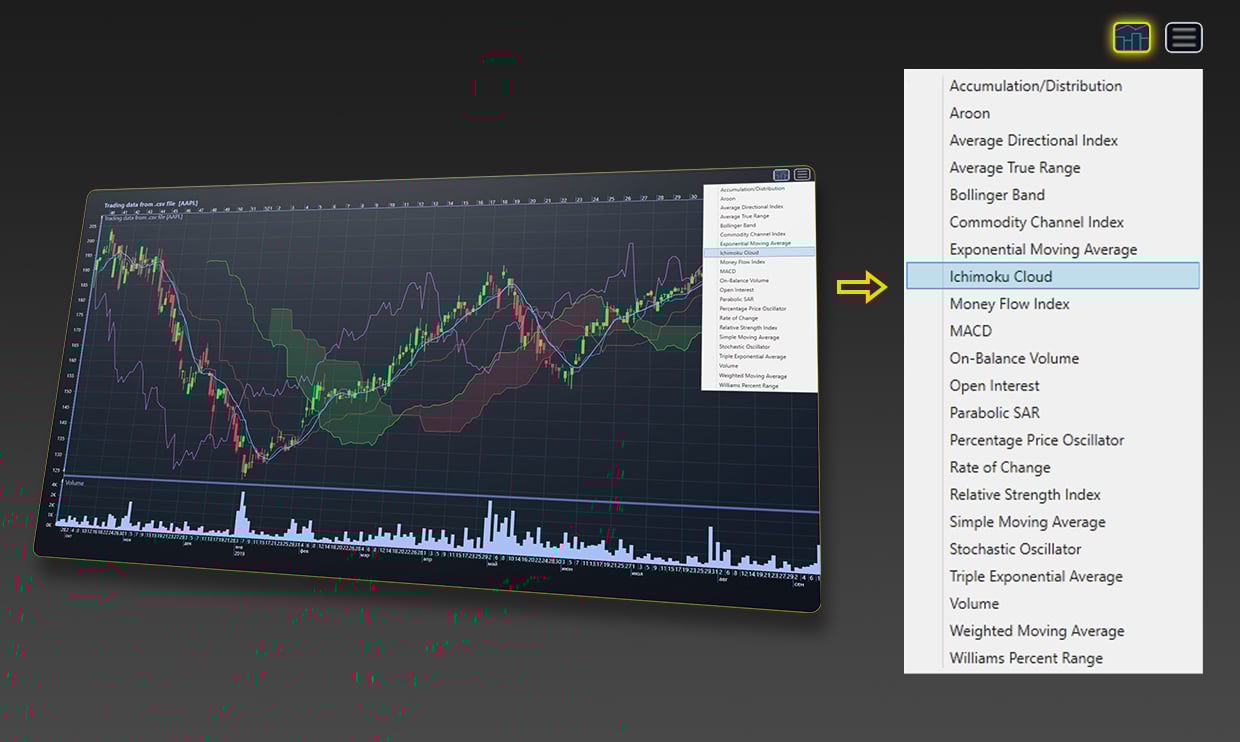
We’ve added seven new technical indicators to the TradingChart control. These are:
- Accumulation/Distribution
- Average Directional Index
- Commodity Channel Index
- Ichimoku Cloud
- On-Balance Volume
- Parabolic Stop-and-Reverse (PSAR)
- Percentage Price Oscillator

TraderChart control displaying all the featured technical indicators
The TradingChart control features now five new drawing tools. These are:
- Elliot Wave
- Head and Shoulders
- Pitchfork
- Triangle
- XABCD Pattern

TraderChart control displaying all the available drawing tools
Altogether, LightningChart .NET features now 10+ drawing tools and 20+ technical indicators, including the previously released Aroon, Rate of Change, TRIX, and Williams Percentage Range.
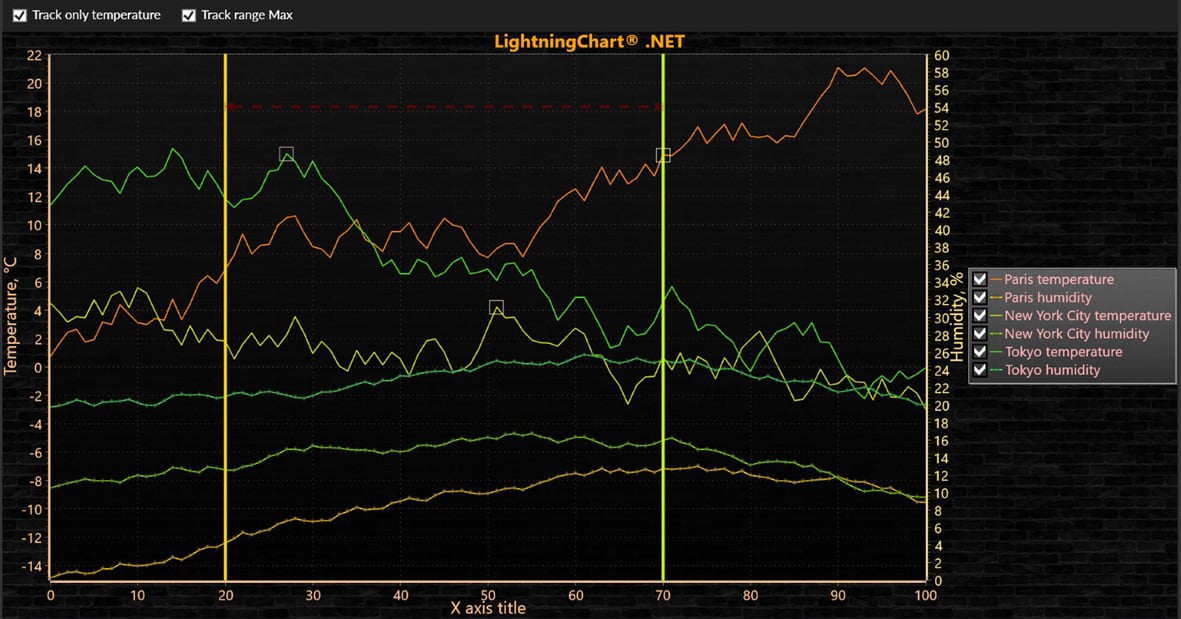
Additional features for the LineSeriesCursor
The TrackLineSeries and SolveYValue features are now available for the LineSeriesCursor. These features help to customize the Cursor tracking behavior.
The TrackLineSeries is Predicate to determine if the cursor should draw/resolve the TrackPoint for a series implementing ITrackable interface.
The SolveYValue feature overrides LineSeriesCursor’s Y-value solving/tracking method.
Func (predefined generic) delegate type can be used with an anonymous method or lambda expression.

LineSeriesCursor
Performance improvements & additional features
In this release, we improved the rendering speed for the 3D Spectrograms by a 50%. Additionally, the 2D Spectrograms’ performance increased by about a 20%.
Many minor errors have been fixed in the library code and we added new examples in our Interactive Examples App. Those newly added examples demonstrate the new features of LineSeriesCursor and potency of library in EEG data visualization. To access the changelog, please visit the LightningChart portal.

EEG Data Visualization
New Pricing
For all our .NET customers, we kindly inform you that in order to cope with the impact of inflation, the prices of all LightningChart .NET licenses will rise by 10% starting from August 1st.
This price change will not affect those invoices and quotations sent out before August 1st. For more information about our new pricing, please visit our pricing page or contact us at [email protected]
Get started with LightningChart .NET v.10.3.2
See more news
Alpha Omega Engineering
Date of case study: 04/2024Industry of business: Clinical NeuroscienceEstablished: 1993LightningChart solution: XY ChartsAlpha Omega EngineeringAlpha Omega is the market leader in physiological navigation for advanced neurosurgical procedures, like deep brain...
JavaScript 2D Bubble Chart
JavaScript 2D Bubble ChartIn this article, we will create a JavaScript 2D bubble chart using Node JS and LightningChart JS. Remember that you can download the template and use it to experiment with it. When we are looking for an attractive way to represent our data,...
Create a JavaScript Stacked Bar Chart
JavaScript Stacked Bar ChartStacked bar charts are very useful in scenarios where we see large groups of data from different categories, or values from each other. We can see how a category is divided into segments, from the largest to the smallest in relation to...
3D Mesh Model Real-Time Coloring
Updated on March 19th, 2024 | Written by human3D Mesh Model Real-Time Coloring ApplicationIn this example, we will be using an airplane object for creating a 3D mesh model real-time coloring application. This application example is useful for visualizing simulations...
