JavaScript Real-Time Polar Sensor Chart
Showcase of using Polar Heatmap to visualize a scatter data set in polar coordinates.
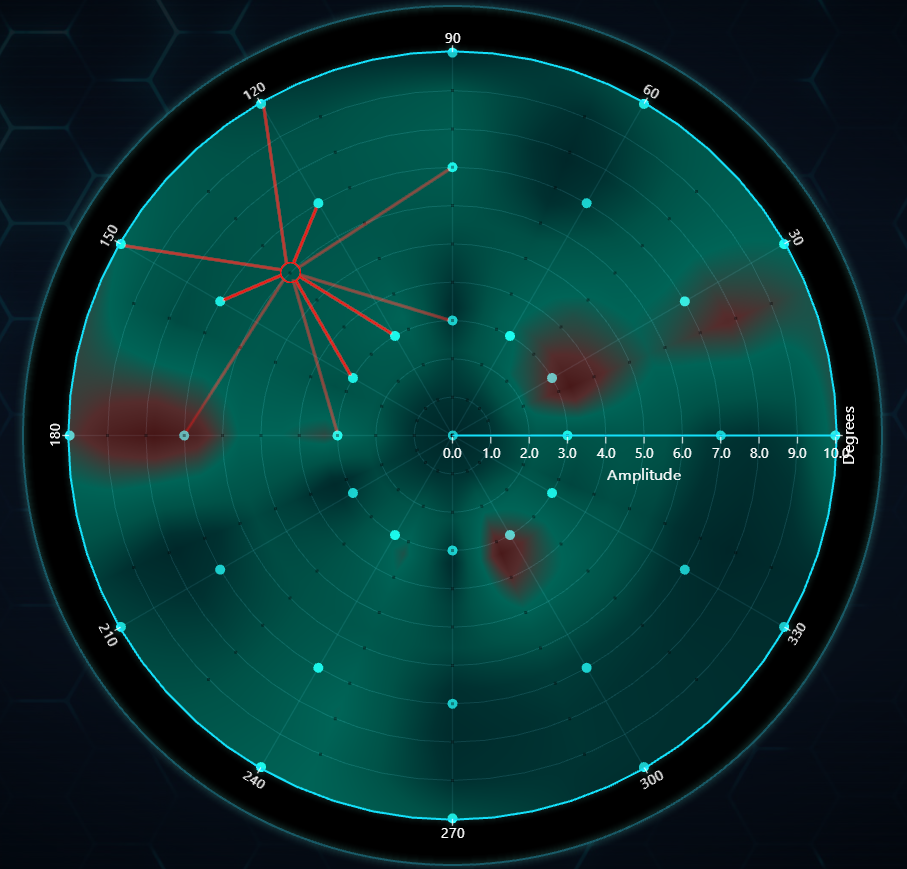
To explain that a bit further, the example establishes a number of sensors that are positioned in polar coordinates (angle + amplitude). Each sensor has a numeric measurement, which could be temperature, voltage, etc. These measurements are then extrapolated to linearly ease in the gaps between the sensors. The final extrapolated data set is then visualized with a heatmap.
The example simulates the sensor measurements changing in real-time (60 times per second), immediately recalculates the extrapolated heatmap data and displays it with low latency.
The extrapolation algorithm can be found in the example source code.
Essentially, it calculates a measurement value for each heatmap cell by considering the value and distance to each sensor.
This is a simple but robust algorithm that works for a variety of use cases.