Close Editor Run Reset Auto Update CJS /*
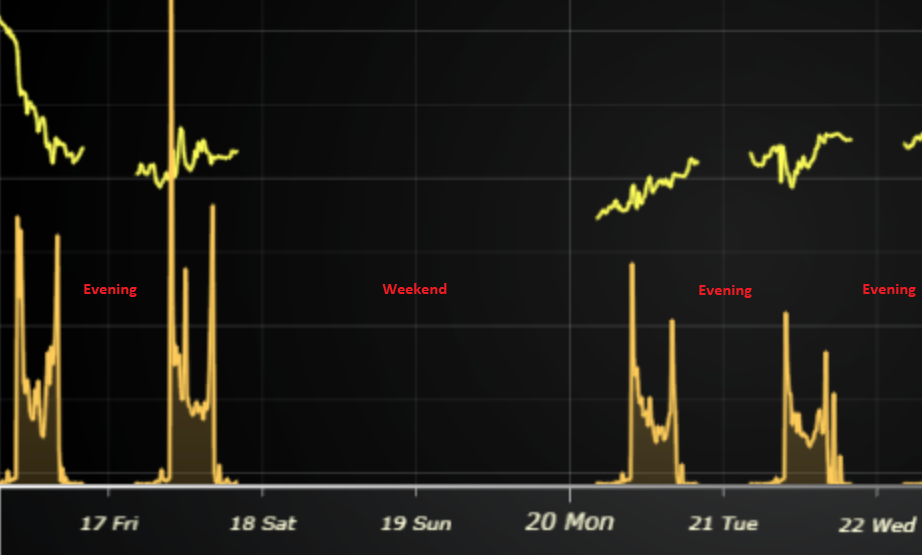
* Example showcasing how data gaps can be handled XY series. Particularly highlights line and area series in a trading use case
*/
// Import LightningChartJS
const lcjs = require('@arction/lcjs')
// Extract required parts from LightningChartJS.
const { lightningChart, AxisTickStrategies, emptyLine, LegendBoxBuilders, Themes } = lcjs
// NOTE: Using `Dashboard` is no longer recommended for new applications. Find latest recommendations here: https://lightningchart.com/js-charts/docs/basic-topics/grouping-charts/
const dashboard = lightningChart()
.Dashboard({
numberOfColumns: 1,
numberOfRows: 2,
// theme: Themes.darkGold
})
.setRowHeight(0, 1)
.setRowHeight(1, 0.2)
const chart = dashboard.createChartXY({ columnIndex: 0, rowIndex: 0 }).setTitle('Chart with data gaps')
const axisClose = chart.getDefaultAxisY().setTitle('Stock price (€)')
const seriesClose = chart
.addLineSeries({
dataPattern: {
pattern: 'ProgressiveX',
},
})
.setName('Stock price (€)')
.setCursorInterpolationEnabled(false)
.setCursorResultTableFormatter((builder, series, x, y, dataPoint) =>
builder
.addRow(series.getName())
.addRow(series.axisX.formatValue(dataPoint.x))
.addRow(`${series.axisY.formatValue(dataPoint.y)} €`),
)
const axisVolume = chart
.addAxisY({ opposite: true })
.setTitle('Volume (€)')
.setTickStrategy(AxisTickStrategies.Numeric, (ticks) =>
ticks
.setMajorTickStyle((major) => major.setGridStrokeStyle(emptyLine))
.setMinorTickStyle((minor) => minor.setGridStrokeStyle(emptyLine)),
)
const seriesVolume = chart
.addAreaSeries({ yAxis: axisVolume })
.setName('Volume (€)')
.setCursorInterpolationEnabled(false)
.setCursorResultTableFormatter((builder, series, position, high, low) =>
builder
.addRow(series.getName())
.addRow(series.axisX.formatValue(position))
.addRow(`${series.axisY.formatValue(high)} €`),
)
const dateOrigin = new Date('2021-01-01')
const dateOriginTime = dateOrigin.getTime()
const axisX = chart
.getDefaultAxisX()
.setTickStrategy(AxisTickStrategies.DateTime, (ticks) => ticks.setDateOrigin(dateOrigin))
// Set preset X default view.
.setInterval({
start: new Date('2021-12-07 20:00:00').getTime() - dateOriginTime,
end: new Date('2021-12-11 06:00:00').getTime() - dateOriginTime,
})
const legend = chart.addLegendBox(LegendBoxBuilders.HorizontalLegendBox).add(chart)
const zoomBandChart = dashboard.createZoomBandChart({ columnIndex: 0, rowIndex: 1 }).setTitle('')
zoomBandChart.add(seriesClose)
zoomBandChart.add(seriesVolume)
fetch(new URL(document.head.baseURI).origin + new URL(document.head.baseURI).pathname + 'examples/assets/0053/data.json')
.then((r) => r.json())
.then((data) => {
// Compile XY data point lists for close series and volume series.
// Data gaps are programmatically detected and marked into the data set.
const dataGapThresholdX = 1 * 60 * 60 * 1000 // 1 hour as milliseconds
const closeDataXY = []
const volumeDataXY = []
let xPrev
for (let i = 0; i < data.length; i += 1) {
const p = data[i]
if (xPrev !== undefined) {
const xGap = p.time - xPrev
if (xGap > dataGapThresholdX) {
// There is a gap in the data set between data points [i - 1] and [i]
// Disconnect the series at this point by adding an extra data point with NaN value between these two data points.
closeDataXY.push({ x: p.time - dateOriginTime, y: Number.NaN })
volumeDataXY.push({ x: p.time - dateOriginTime, y: Number.NaN })
i += 1
}
}
closeDataXY.push({ x: p.time - dateOriginTime, y: p.close })
volumeDataXY.push({ x: p.time - dateOriginTime, y: p.volume })
xPrev = p.time
}
seriesClose.add(closeDataXY)
seriesVolume.add(volumeDataXY)
})
JavaScript Data Gaps Trading Chart - Editor Normally, series types such as LineSeries, AreaSeries, etc. automatically connect data points to highlight the progression of trend values. In some specific use cases, this is not the ideal behavior as data may contain frequent data gaps , meaning relatively large time intervals when there are no data samples available.
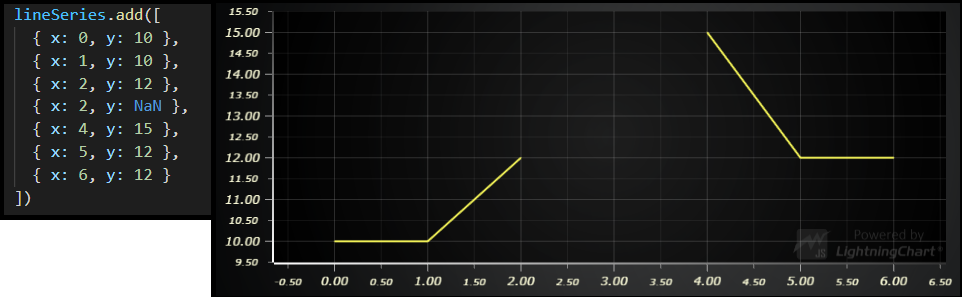
In LightningChart JS, data gaps can be specified by adding an extra data point with value of NaN (Not-A-Number ).
The code of this example shows one way of automatically detecting gaps in data sets and adding the NaN data points in. By default it looks for 1 hour difference between two data points, but this can be easily modified.