Example that showcases LineSeries feature for coloring line dynamically based on X coordinates.
In this example, there is a ECG data set (voltage measurements from a heart over short period of time). This data is visualized as a Line Chart where X dimension represents time and Y dimension measured voltage.
This is a very traditional and well known setting, but this example adds a little twist to it in order to showcase the dynamic X coloring feature.
The example code automatically detects heart beats from the data set and tracks the X coordinate intervals that contain active heart beats.
This heart beat information is then used to prepare a Value - Color lookup table, a conceptually simple object that can be widely used with many different LightningChart JS components.
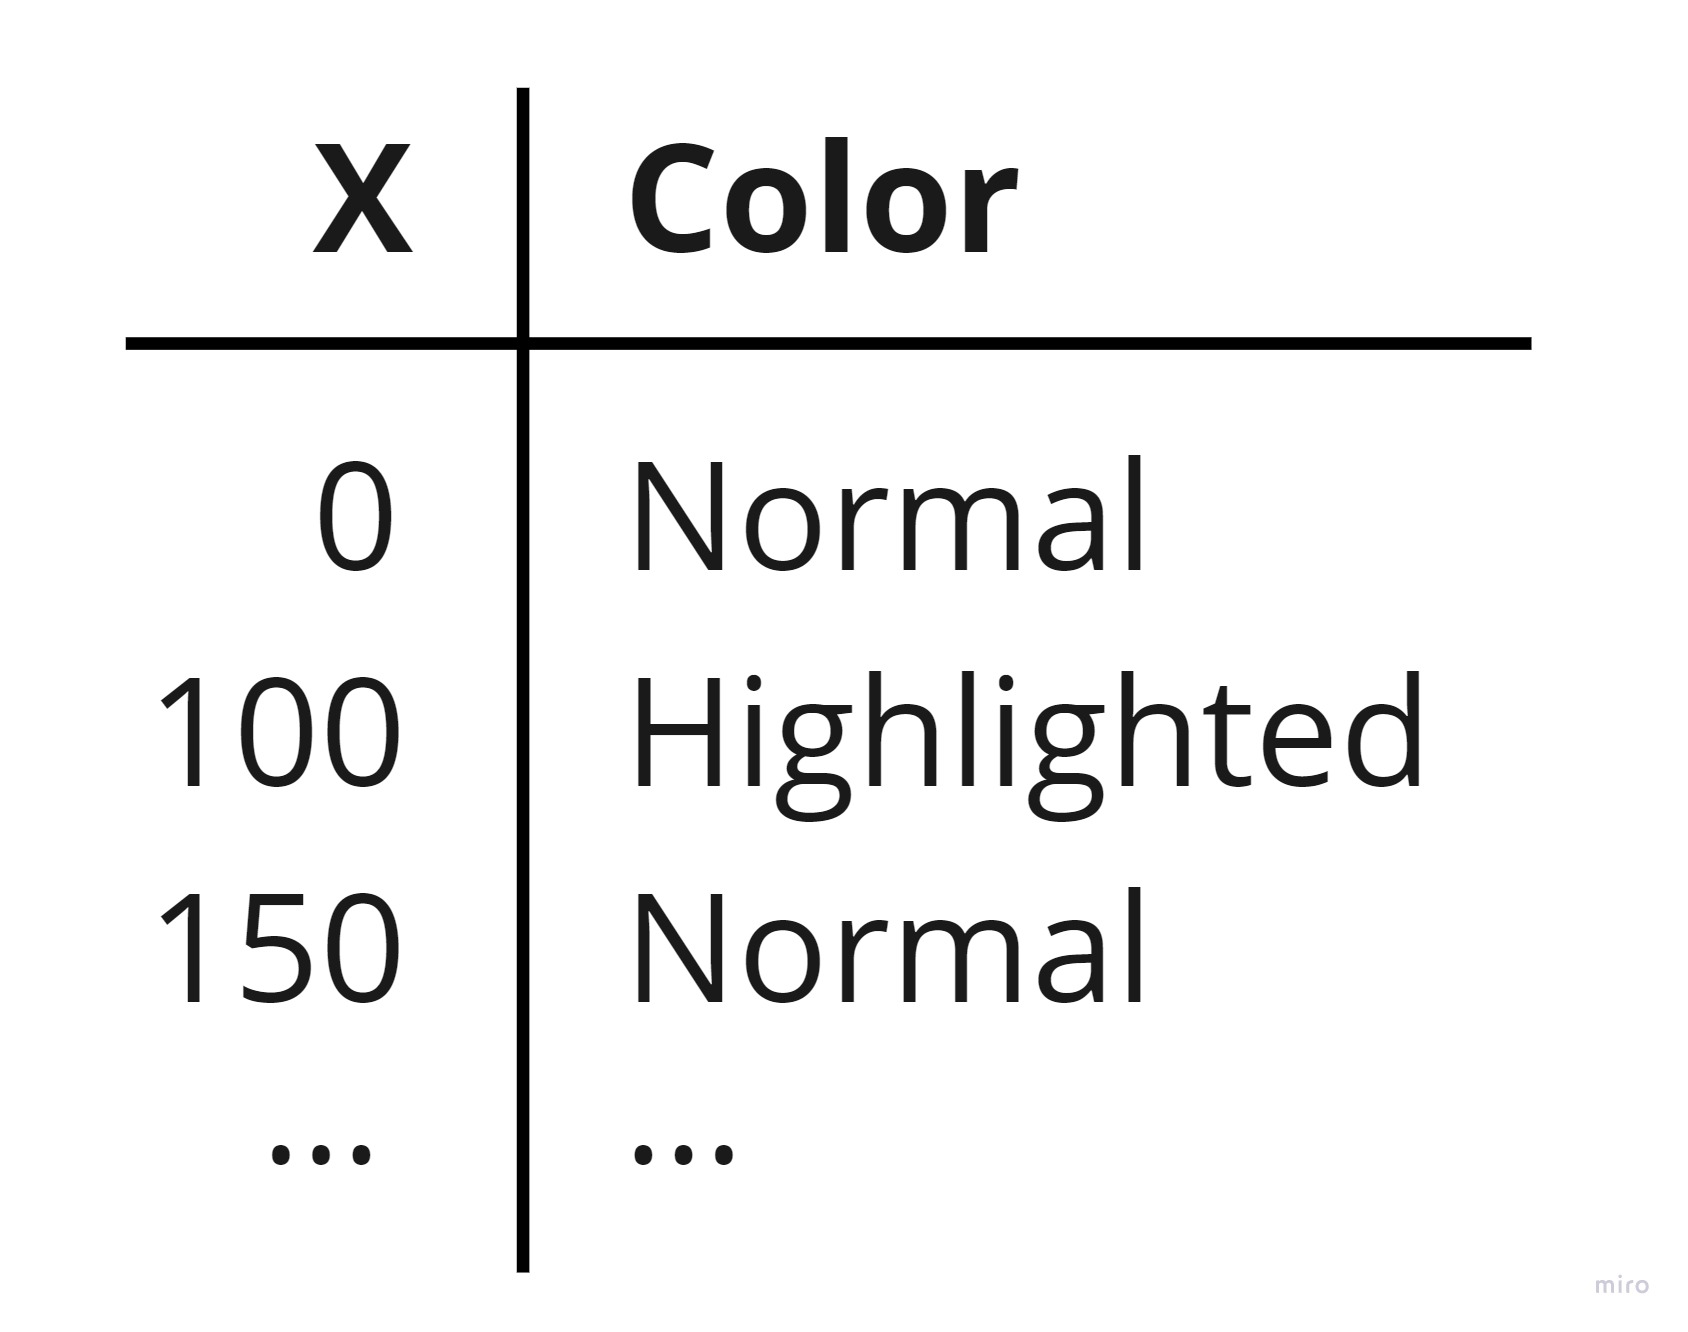
The lookup table associates a range of Values with corresponding Colors. In this example, this means defining the X value ranges which should be colored "normally" and ranges which should be colored in "highlighted" manner.
Dynamic line coloring is a powerful feature which can serve many different needs. The best thing about it is that it doesn't compromise performance, meaning that you can use it just as well with 100 data points or 100 million data points.
In addition to dynamic coloring by X coordinate there are also more dynamic coloring modes available: