Date of case study: 05/2020
Industry of business: Engineering
Established: 1971
LightningChart solution: XY, 3D and Polar charts
Cambridge Self-Boring Pressuremeter
Since 1972 Cambridge Insitu Ltd have been leaders in the design, manufacture, and site operation of Pressuremeters. These are geotechnical instruments, utilised for measuring ‘insitu’ stiffness and strength of geomaterials (soils and rocks). Their devices are found worldwide and have been used on many high-profile civil engineering projects. In addition, Cambridge Insitu makes load cells and similar devices which use strain gauges, to their own design and in co-operation with others. Staff at Cambridge Insitu are experienced in the design and manufacture of data logging systems and writing software for recording and displaying data.
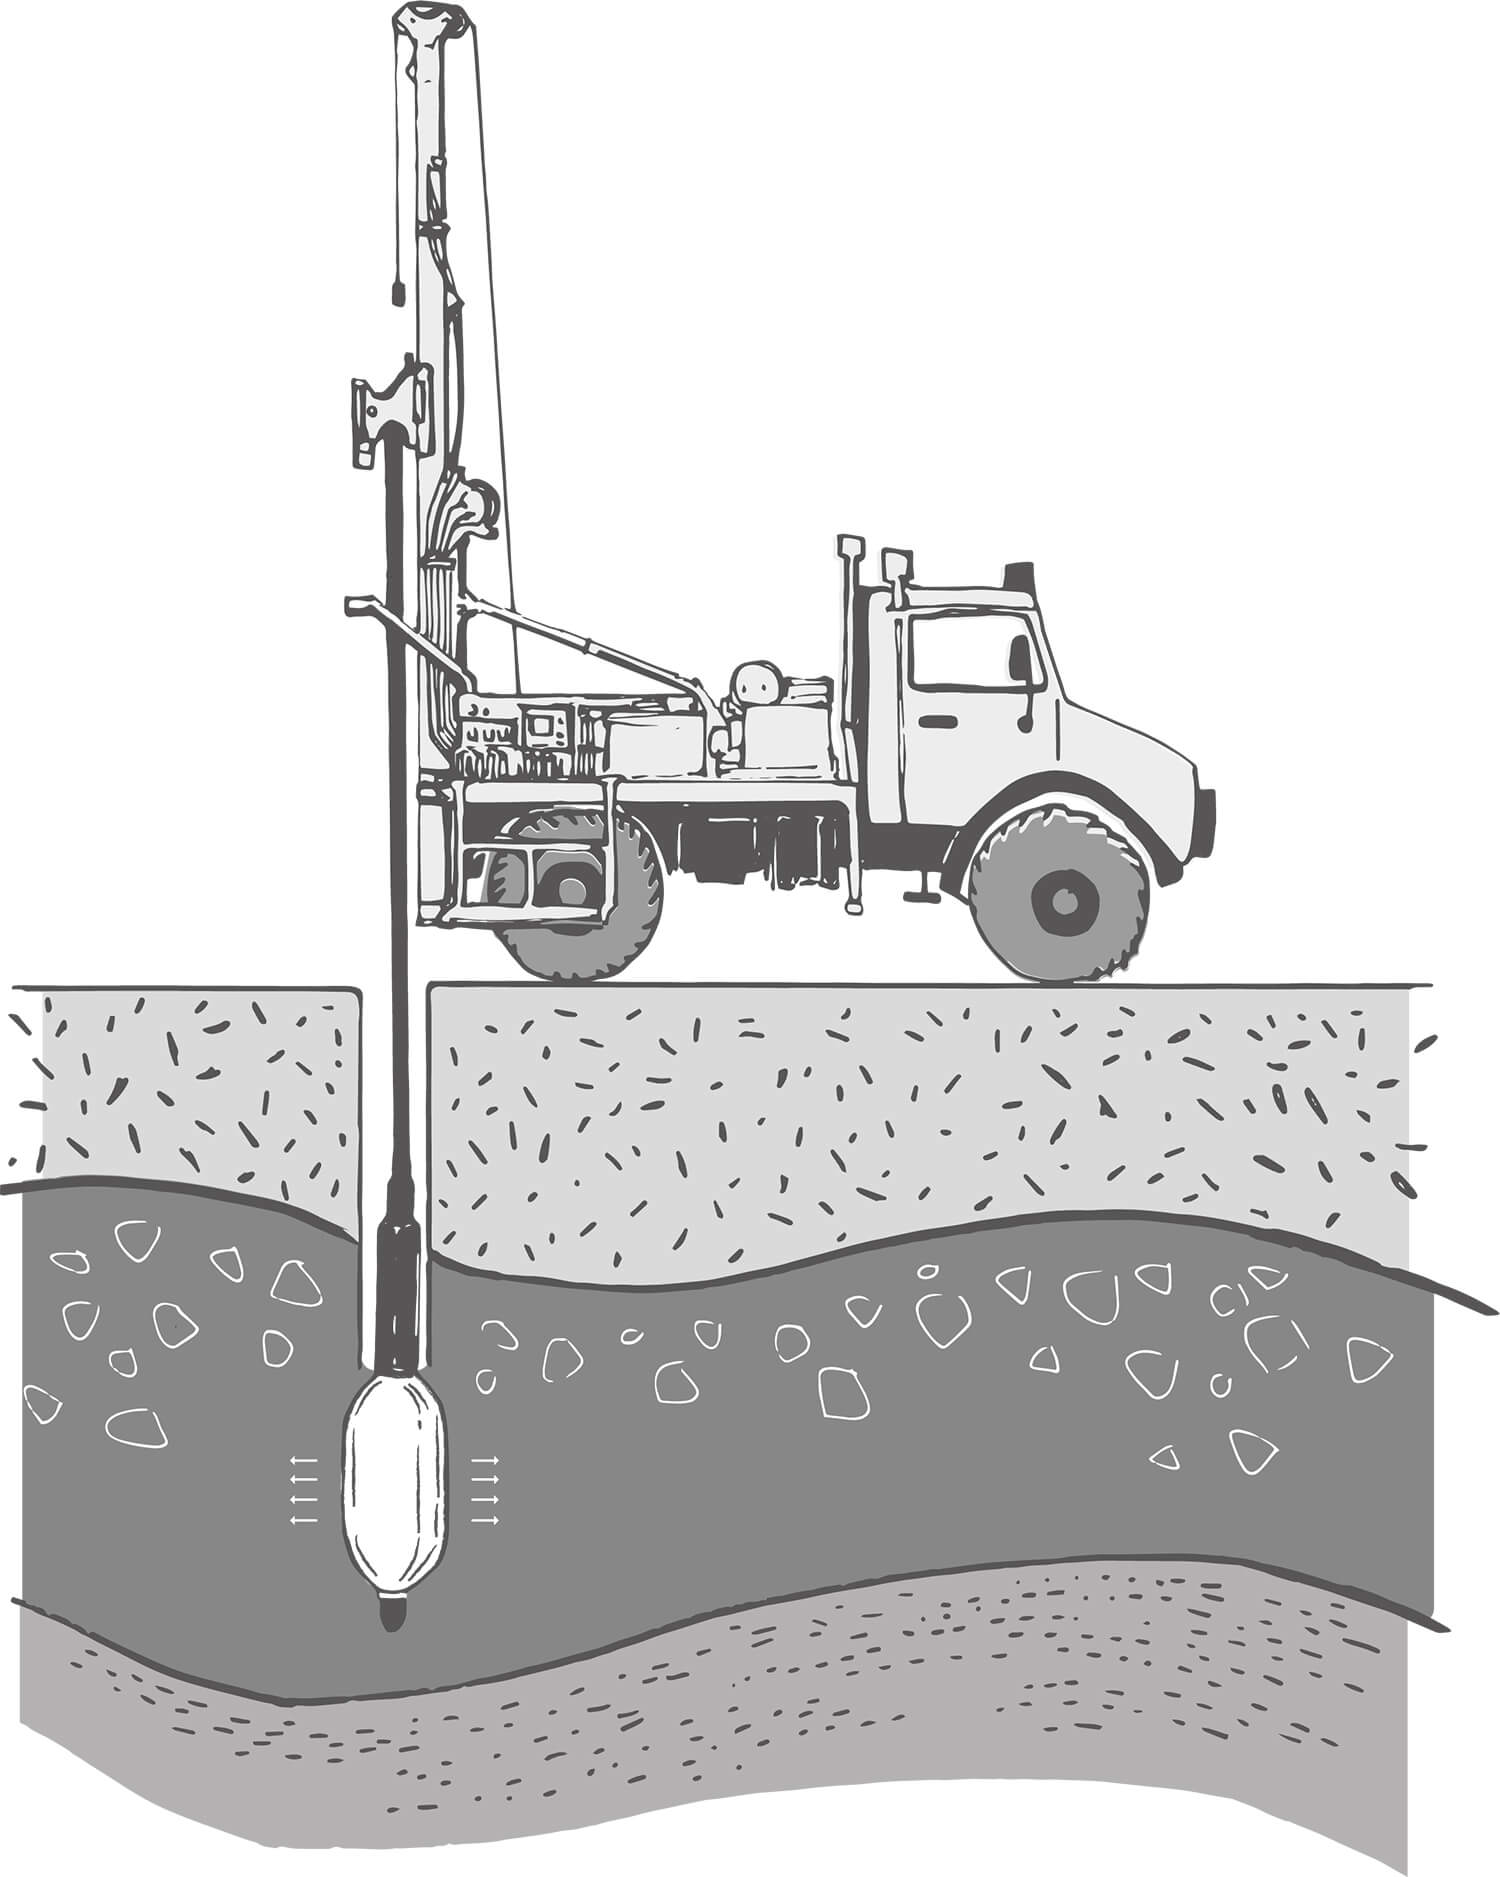
Picture 1. Cross Section Diagram
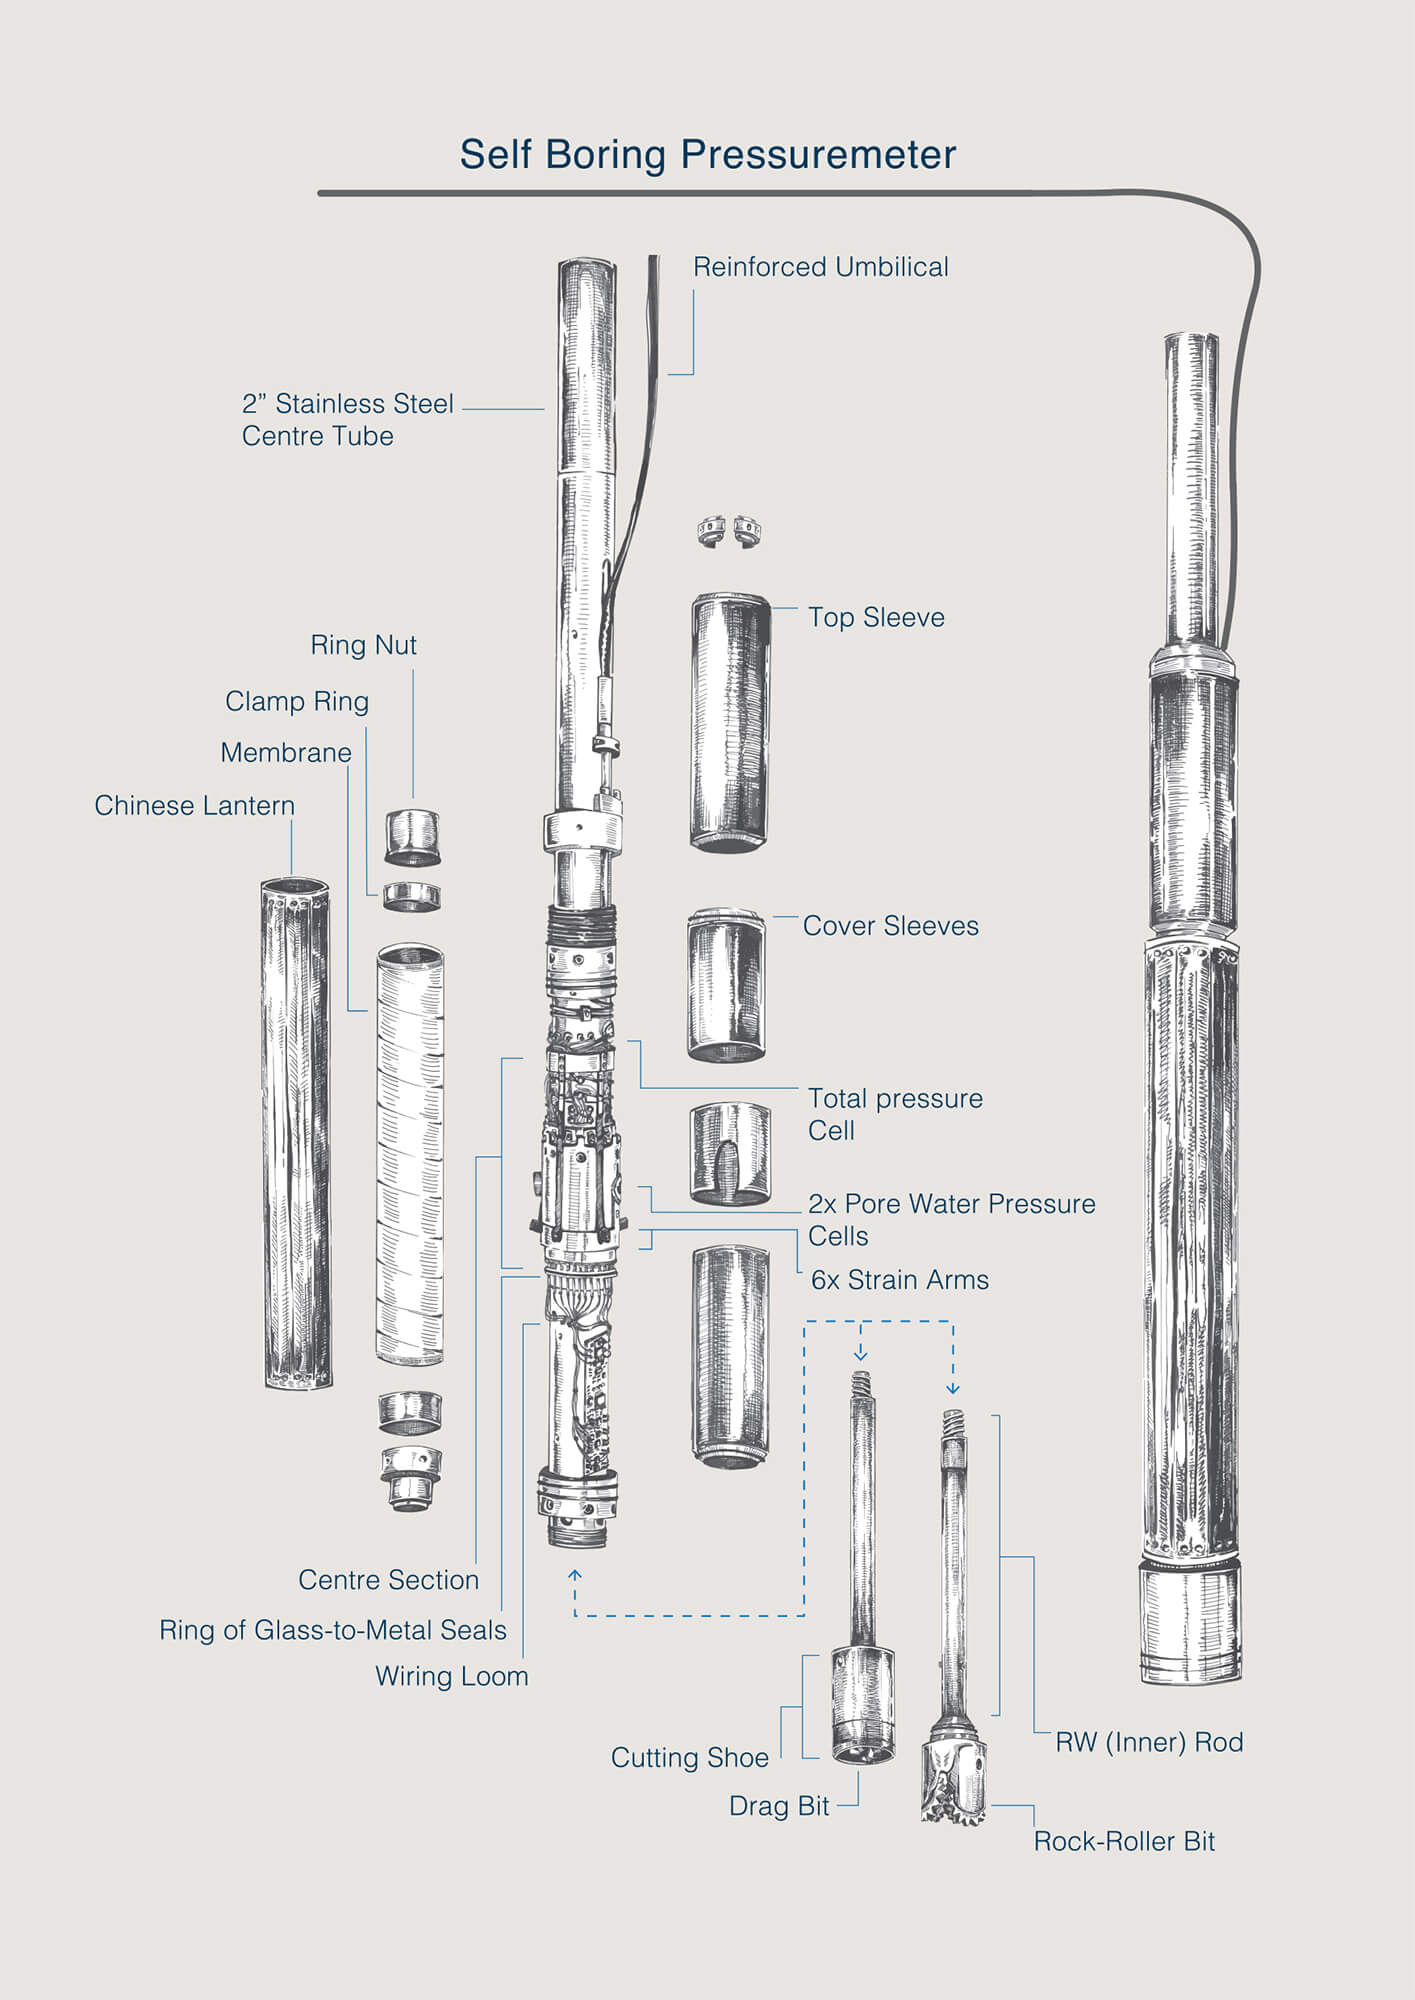
Picture 2. Self-Boring Pressuremeter
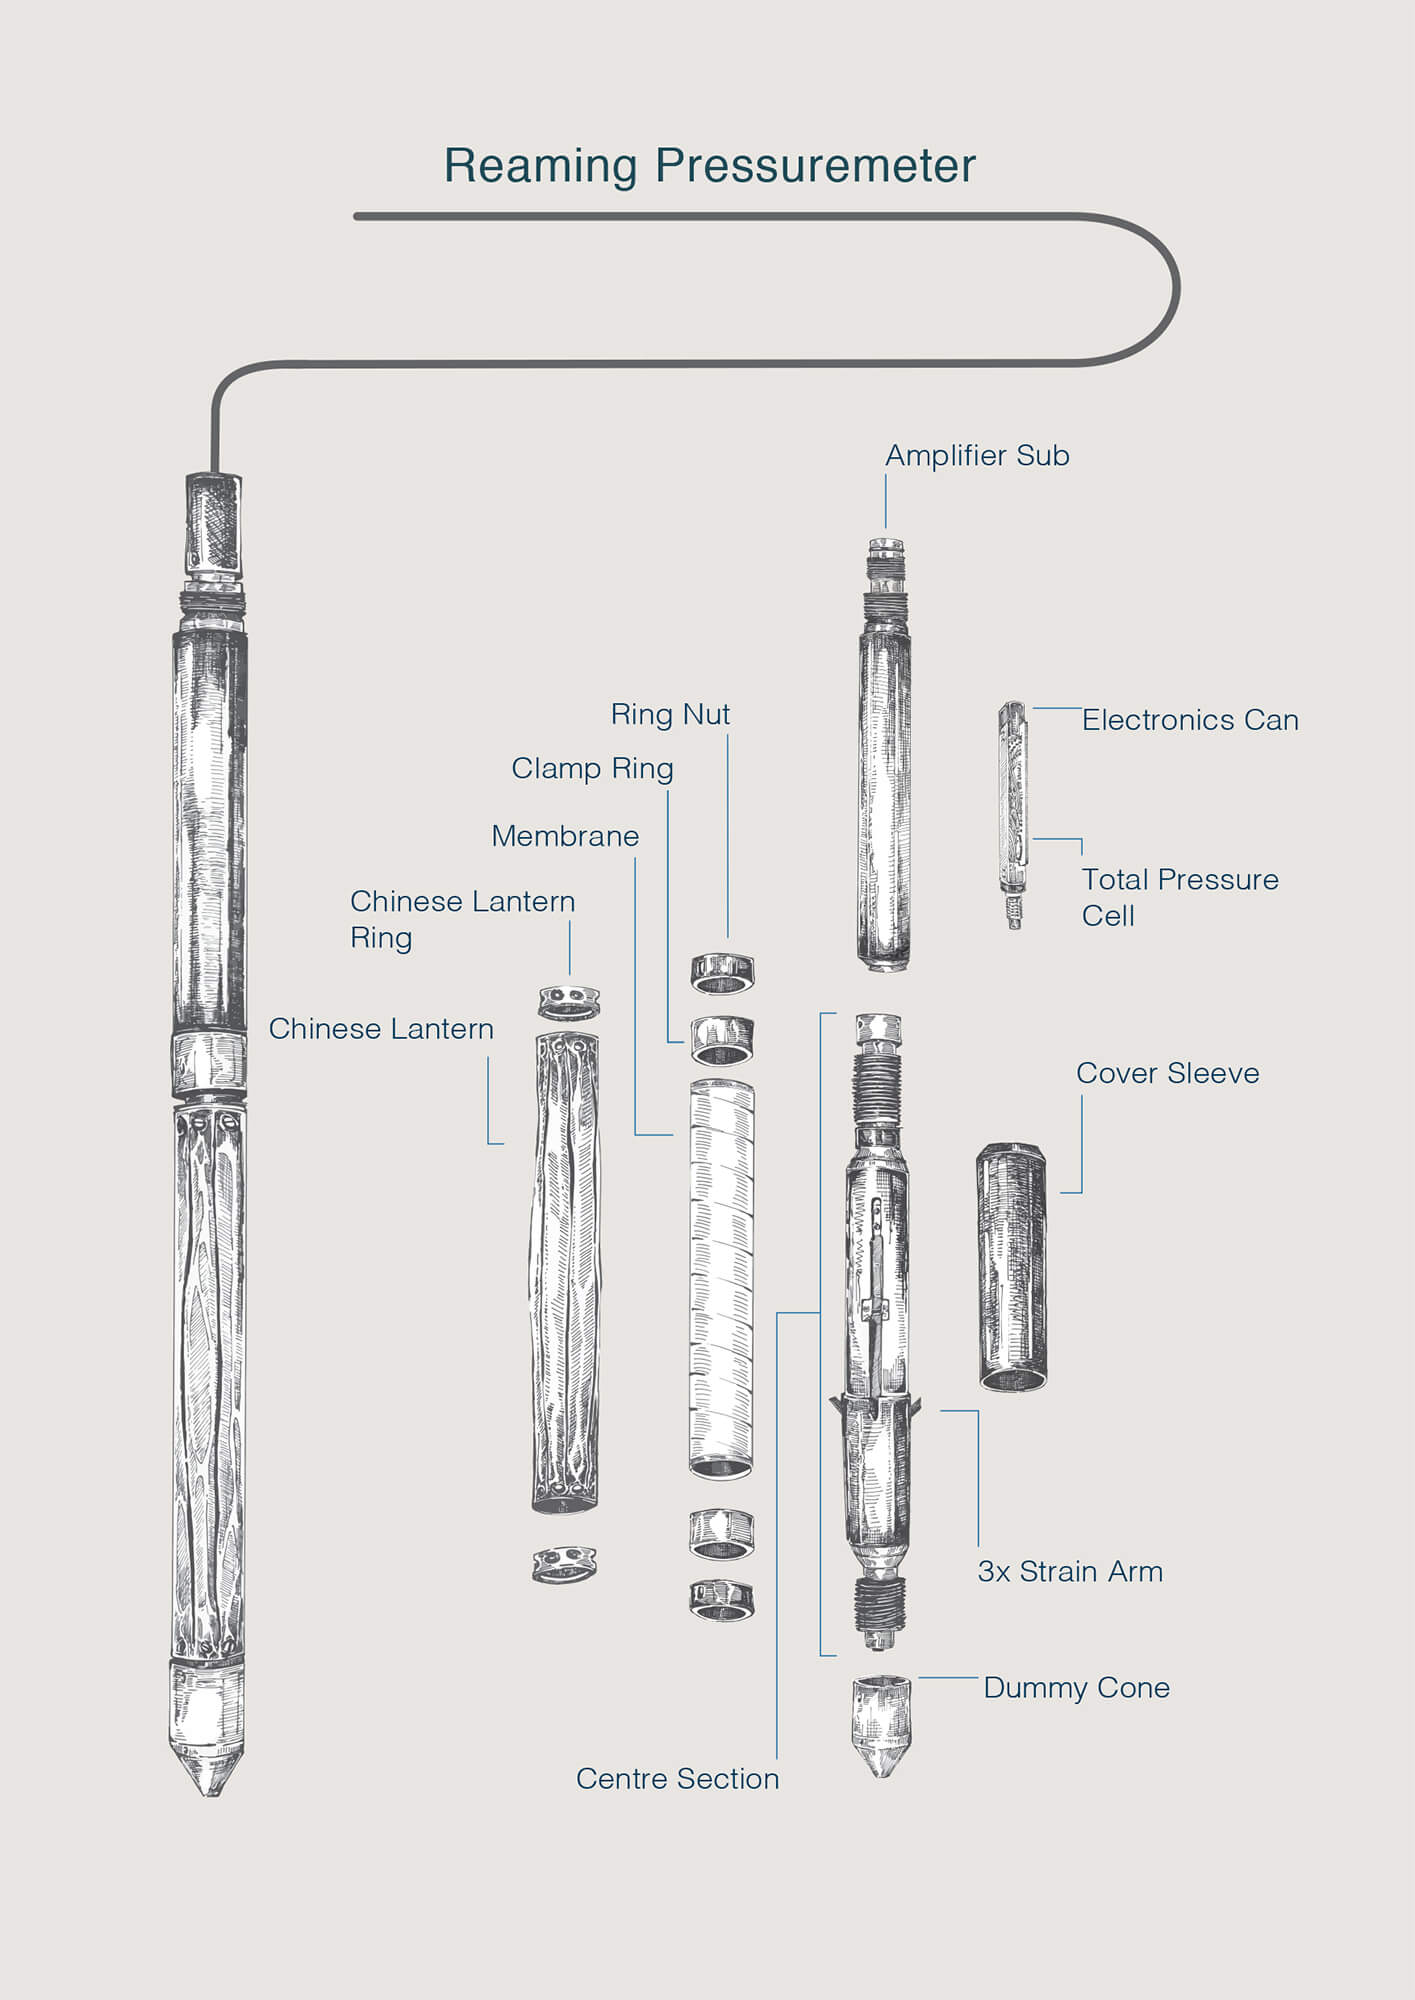
Picture 3. Reaming Pressuremeter
All images created by Piera Cirefice Illustration©
Ge-Log is a logging program developed for the Cambridge Insitu Pressuremeter by Isaac Cragg, the director of Gecode Ltd. This program records and displays in a graphics-dominated way, live Pressuremeter data which is then used for numerical analysis.
The procedure of a site investigation using a Cambridge Pressuremeter includes inserting a pressuremeter into the ground and inflating the probe, resulting in a measured amount of pressure and displacement in the Pressuremeter. These variables are recorded by Ge-Log, having been measured via strain-arms and a total pressure cell transducers within the instrument.
- 3D Heat maps of the pressuremeter membrane either showing expansion or excess pore water pressure.
- 2D rose diagram of individual arm expansion.
- X/Y charts of average arms and all arms.
- Project Manager programme which integrates with excel and can be used for invoicing purposes.
- Arm calibration suite (strain transducer calibration).
- Pressure cell calibration suite (pressure transducer calibration).
- Membrane calibration suite.
- Stick up calculator – (Auto depth calculator).
- Demo mode – (Allows the user to replay, pause, increase/decrease speed of the test.) This is intended for presenting to clients.
LightningChart is used as the main charting component in the Ge-Log pressuremeter software. It is used to display live pressuremeter data. Data is either displayed as an XY-chart (probe expansion/pressure), 3D heatmap (expansion) or radial expansion using a modified polar chart. Extra features include the ability to change the color and shape of the points in XY-charts.
Charts are also used to create linear lines which can be adjusted to plot regression lines on the XY-charts; these are used for membrane calibrations. This ability will be duplicated to do the analysis of the tests in the future software Ge-Analysis.
“LightningChart’s 3D rendering, zoom function and smooth panning are the best attributes of the charting component. LightningChart has overall allowed the development of a new piece of software, which wouldn’t be possible without the charting component. Also, LightningChart’s technical support has a fantastic and quick response, which allowed me to make improvements to the software.”


