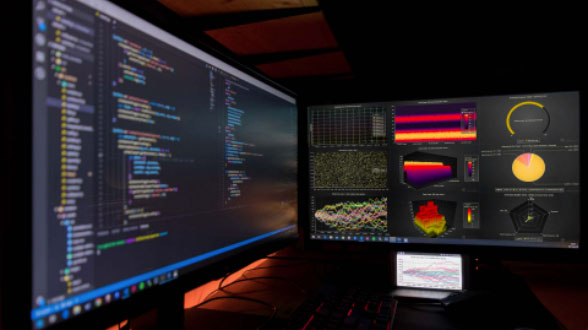
Telemetry Data Visualization Application
TutorialUsing NodeJS to Create an F1 Telemetry Data Visualization Application
We’ll develop with NodeJS a racing car track data analysis chart
A racing telemetry application can be built using the chart type XY and is possible to draw a racing circuit only with the given coordinates. This is a very helpful feature because it can be applied to many cases where coordinates and other values are provided, in this case, we need to work with the speed, throttle, and steering of the racing vehicle that will be visualized along the race track.
Both the data as well as the use case in this example originate from a real user of LightningChart JS: TestLogger. TestLogger produces a complete data management and analytics system for RC cars and is one of our satisfied long-time partners.
So, to begin with, this project can be downloaded, and you will be able to replace the values in each JSON file and construct your own racing analytics application.
Project overview
Moreover, all these incoming data must be processed and visualized with the help of data visualization toolkits that display the data points in the chart. In other words, what you’ll create now.
Have a look at what you’ll create:
Configuring the Template
- Please, download the template that is provided in this article.
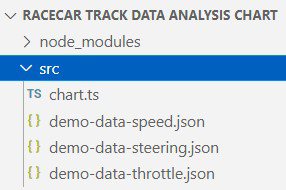
- You will see a file tree like this one:
4. As usual in a Node JS project, we will have to run our NPM Install command.
This would be everything for our initial setup.
Let’s code.
JSON files
- In our demo-data-speed.json file we will see the following structure:
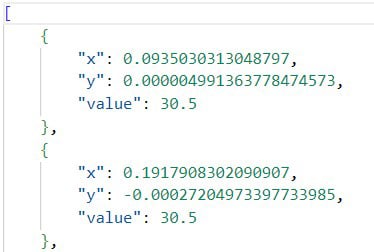
- X: Value for the X axis.
- Y: Value for the Y axis.
- value: value for speed, throttle, or steering, found in each JSON file, respectively.
The same logic can be applied to demo-data-throttle.json and demo-data-steering.json
CHART.ts
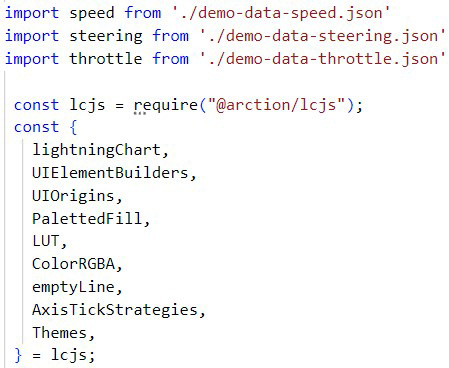
- Import JSON data files.
- Declare the constant lcjs that will refer to our @arction/lcjs library.
- Extract required classes from lcjs.
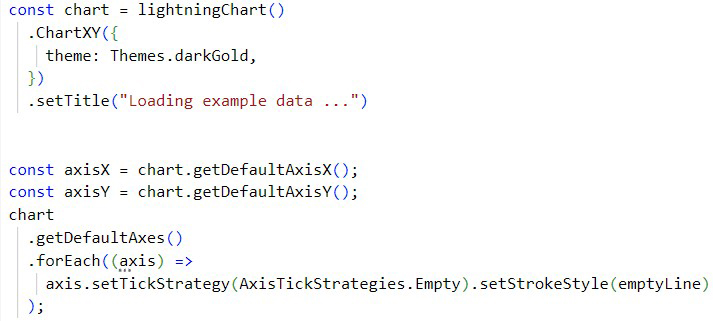
- Const Chart: constant with the chart properties.
- ChartXY: Type of chart.
- setTitle: Initial title that will be displayed before the chart is updated.
- Const axisX: This will always return a reference to the X Axisthat is closest to the chart (starting from the bottom). The user can safely destroy the default Axis (with dispose, as long as there are no series attached to it).
- Const axisY: This will always return a reference to the Y-Axis closest to the chart (starting from the bottom). The user can safely destroy the default Axis (with dispose, as long as there are no series attached to it).
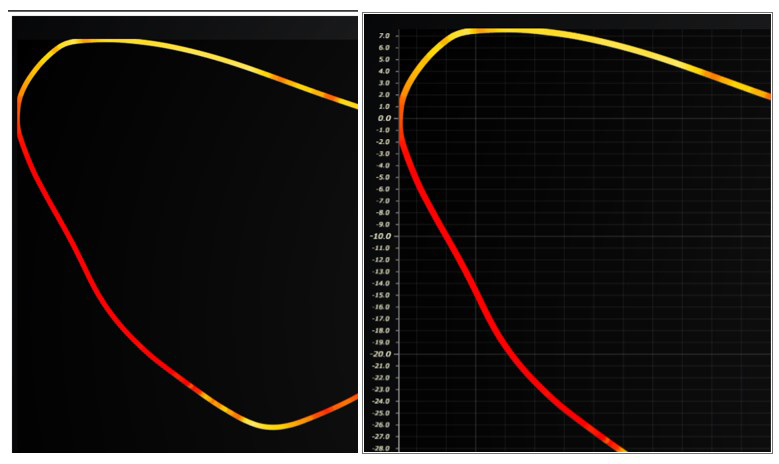
- setTickStrategy: This property with [empty] value can hide the axis labels.
- const dataSources: This JSON will contain the values and properties for each type of chart (speed, throttle, and steering).
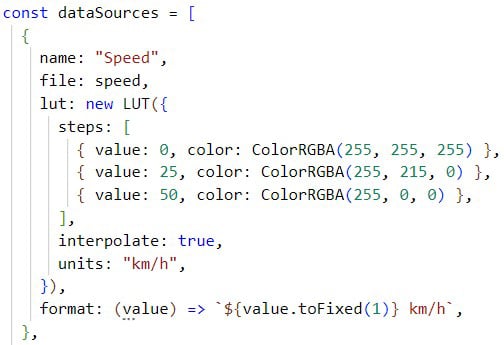
- Name: Name of the chart
- File: import the object of each JSON file.
- LUT: (Look Up Table) Style class for describing a table of colors with associated lookup values (numbers).
Instances of LUT, like all LCJS style classes, are immutable, meaning that its setters do not modify the actual object, but instead return a completely new modified object.
Properties of LUT:
- steps: List of color steps (color + number value pair).
- interpolate: true enables automatic linear interpolation between color steps. Read more about LUT here.
- Format: Format for the displayed value.
displayDataSource:
- The asynchronous method will return all data for the selected chart.
The chart will be specified by its name as a parameter(sourceName) when the method is called.
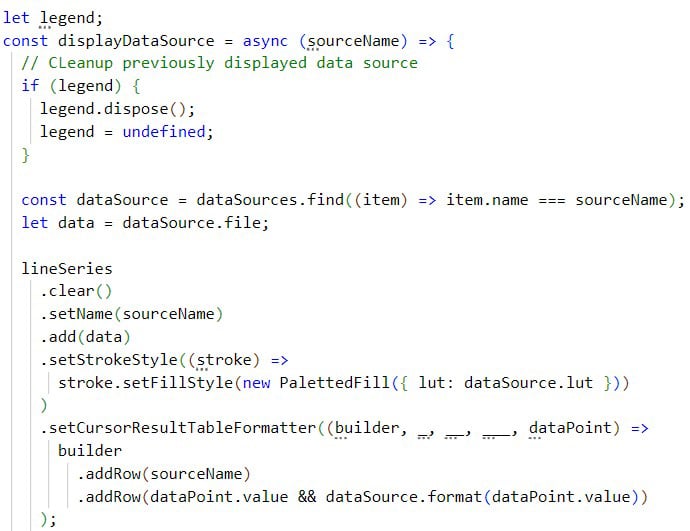
- dataSource: you will find the JSON element from the JSON dataSources created in the previous step. It will use the sourceName parameter value to search the element by the name property. Also, the JSON content from the JSON data file will be stored in the data variable.
- lineSeries: properties for the chart.
- setName: name of the series.
- Add: source data previously stored in the data variable.
- setStrokeStyle: LUT properties created in the data source JSON object.
- setCursorResultTableFormatter: Configure formatting of Cursor ResultTable when pointing at this series.
- startValues: Using the [start] constant, we can specify where the “START” label can be located. The default value should be 0 if we want to start from the beginning of the race.
- labelStart: UI properties for the “START” label.
- setTitle: new title to be displayed after all code has been processed.
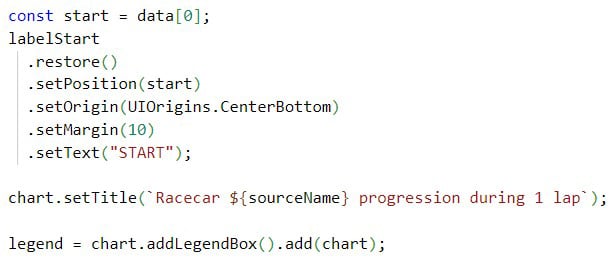
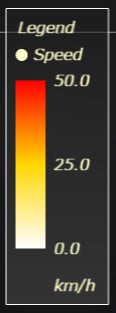
- addLegendBox: A box controller will be created from the chart object. This will represent the data as a single bar, and will have the option to hide the entire chart:
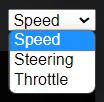
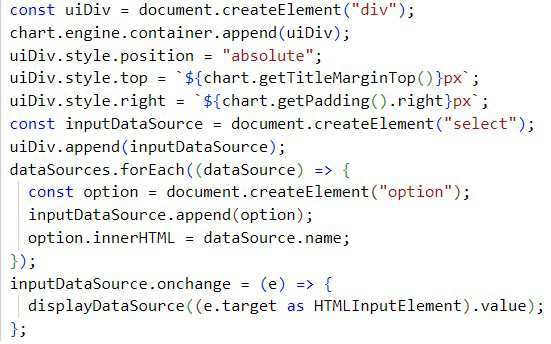
- Dropdown selector:
NPM Start
Conclusion
As mentioned at the beginning of this article; the data is real, which allows idealizing the large number of applications that can be generated, having this template as a basis for experimentation.
Flight monitoring, automobile route monitoring, package monitoring, and moving objects (drones, projectiles, etc.), could be some common examples with which you could experiment.
If you have read our previous articles, you will be able to see in greater detail some of the properties shown here, but with settings that enrich the graph display.
If you got here, I really appreciate your support and keep reading about racing analytics and telemetry applications in motorsports.
Thanks, bye!


